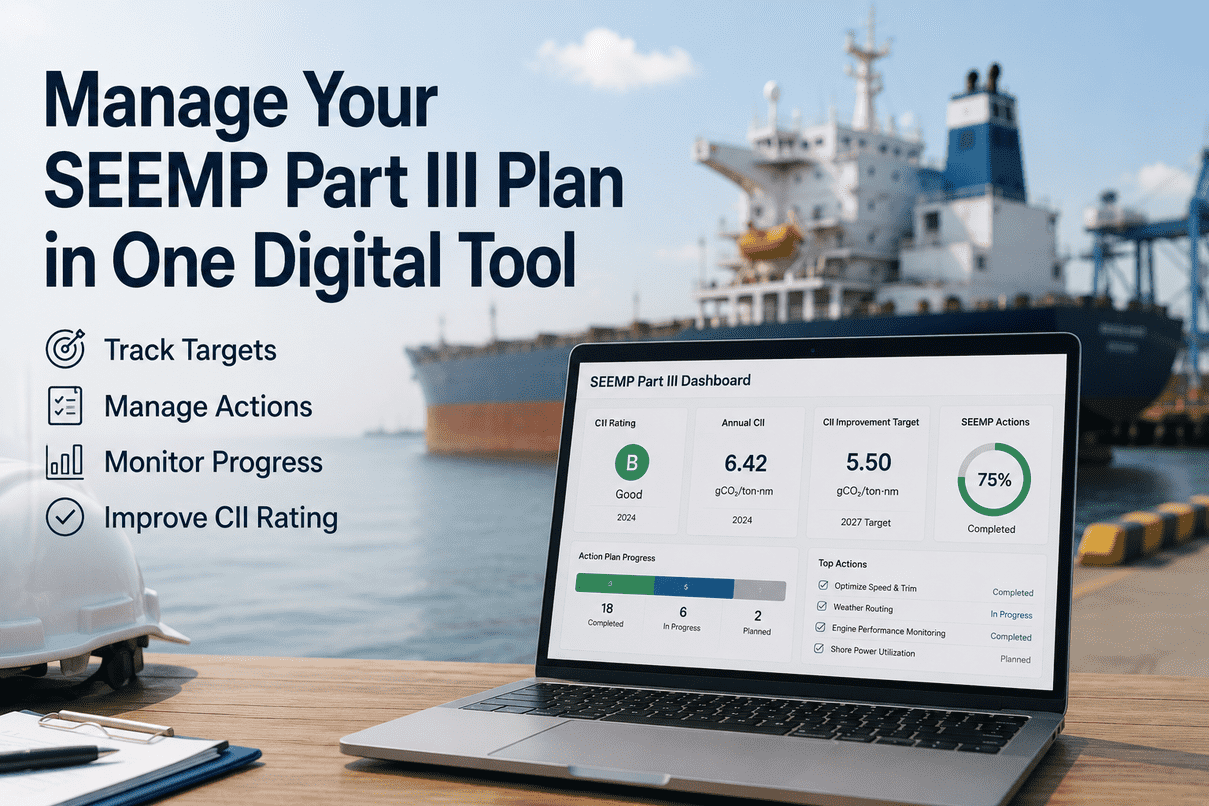
The Carbon Intensity Indicator has crossed a threshold in 2026 — it is no longer just a compliance metric but a commercial performance indicator that directly affects vessel earnings, charter attractiveness, financing terms, and asset value. With an estimated 42% of the global tanker, bulk carrier, and container fleet at risk of D or E ratings if they haven't modified operations, and rating thresholds tightening by approximately 2% annually, every ship above 5,000 GT faces an increasingly narrow corridor between profitable operation and regulatory penalty. CII measures how efficiently a vessel transports cargo, expressed as grams of CO2 emitted per cargo-carrying capacity per nautical mile. Ships receive an annual rating from A (major superior) to E (inferior), and the consequences of poor ratings are real: a D rating for three consecutive years or an E in any single year triggers mandatory corrective action plans, increased PSC and commercial scrutiny, and diminished charter prospects. This guide covers the CII calculation, what each rating means, practical improvement measures (both operational and technical), how to build a corrective action plan, and the commercial implications fleet managers must navigate. Start a free trial of Marine Inspection to track CII performance, fuel consumption data, and maintenance records across your fleet.

CII Rating Scale: Where Does Your Vessel Stand?
A
Major Superior
Best performers — eligible for port incentives, green financing, and premium charter rates
B
Minor Superior
Above target — strong commercial position, low regulatory risk
C
Moderate
Minimum acceptable — meets requirements but at risk as thresholds tighten annually
D
Minor Inferior
Warning zone — 3 consecutive D years triggers mandatory corrective action plan
E
Inferior
Immediate action — corrective plan required after a single E year. Reduced commercial access.

How CII Is Calculated

The CII uses the Annual Efficiency Ratio (AER), measuring CO2 emissions relative to transport work over a full calendar year. Understanding the formula reveals exactly which operational levers you can pull to improve your rating.

CII Calculation Formula (AER Method)
CII = Annual CO2 Emissions / (Capacity x Distance)
CO2 Emissions (numerator)
Sum of all fuel consumed x emission conversion factor for each fuel type. Covers main engine, auxiliary engines, and boilers. Lower fuel consumption = lower CII.
Capacity (denominator)
Deadweight tonnage (DWT) for most cargo ships, or Gross Tonnage (GT) for cruise and Ro-Ro passenger vessels. Fixed per vessel — you can't change this.
Distance (denominator)
Total nautical miles sailed in the calendar year — all voyages, laden and ballast. More efficient routing = same transport work with less fuel.
The only way to improve CII: reduce the numerator (burn less fuel) or increase the denominator (travel more distance per unit of fuel). Every improvement measure targets one or both.

CII Reduction Targets: How the Bar Keeps Rising

The required CII becomes stricter each year — meaning a C-rated vessel today can become D-rated next year without changing anything. This is the treadmill that makes CII management continuous, not one-time. Book a Marine Inspection demo to see how real-time CII monitoring helps you stay ahead of tightening thresholds.

Table 1: CII Annual Reduction Factors (% Below 2019 Reference Line)
Year Reduction Factor (Z%) Cumulative Reduction What This Means Status
2023 5% 5% First year of CII reporting and rating Completed
2024 7% 7% First year ratings issued (for 2023 data) Completed
2025 9% 9% Thresholds tighten — marginal C ships start falling to D Completed
2026 11% 11% Review year — IMO evaluating effectiveness and post-2026 targets Current Year
2027-2030 TBD TBD Post-review reduction factors set by MEPC.400(83) — expected to tighten further Upcoming

20 Proven Measures to Improve Your CII Rating

Every CII improvement measure targets the formula: reduce fuel burned (numerator) or increase transport efficiency (denominator). Here are the operational and technical measures ranked by implementation speed and typical impact.

Table 2: CII Improvement Measures — Operational vs Technical
Category Measure Typical CII Impact Implementation Time Relative Cost
Operational Speed optimization / slow steaming 5-15% fuel reduction Immediate Zero (may affect voyage time)
Operational Weather routing / voyage optimization 3-5% fuel reduction Immediate Low (software subscription)
Operational Just-in-time (JIT) arrival — avoid rush-to-wait 2-5% fuel reduction Immediate Zero (coordination effort)
Operational Trim optimization 1-3% fuel reduction Immediate Zero to low
Operational Auxiliary engine load management 1-2% fuel reduction Immediate Zero
Technical Hull cleaning (underwater + dry-dock) 3-9% fuel reduction 1-4 weeks $12K-50K per cleaning
Technical Propeller polishing / cleaning 1-5% fuel reduction 1-3 days $5K-15K
Technical Low-friction hull coatings (silicone/foul-release) 3-6% fuel reduction Next dry-dock $50K-200K (coating)
Technical Engine power limitation (EPL/ShaPoLi) Variable (limits max power) 2-6 weeks $20K-80K
Technical Energy-saving devices (pre-swirl stators, ducts, fins) 3-8% fuel reduction Next dry-dock $100K-500K
Technical Waste heat recovery systems 3-8% fuel reduction Major retrofit $500K-2M
Technical Air lubrication systems 5-10% fuel reduction Major retrofit $1M-3M
Technical Wind-assist (rotor sails, wing sails) 5-15% fuel reduction (route dependent) 3-6 months $1M-5M per unit
Fuel Low-carbon fuels (LNG, methanol, biofuels) Up to 25%+ CO2 reduction Infrastructure dependent Variable (premium + retrofit)
Track CII Performance in Real Time
Marine Inspection connects fuel consumption data, voyage records, hull maintenance history, and engine performance into one dashboard — giving you year-to-date CII projections so you can adjust operations before year-end, not after.

The Corrective Action Plan: What Happens When You Rate D or E

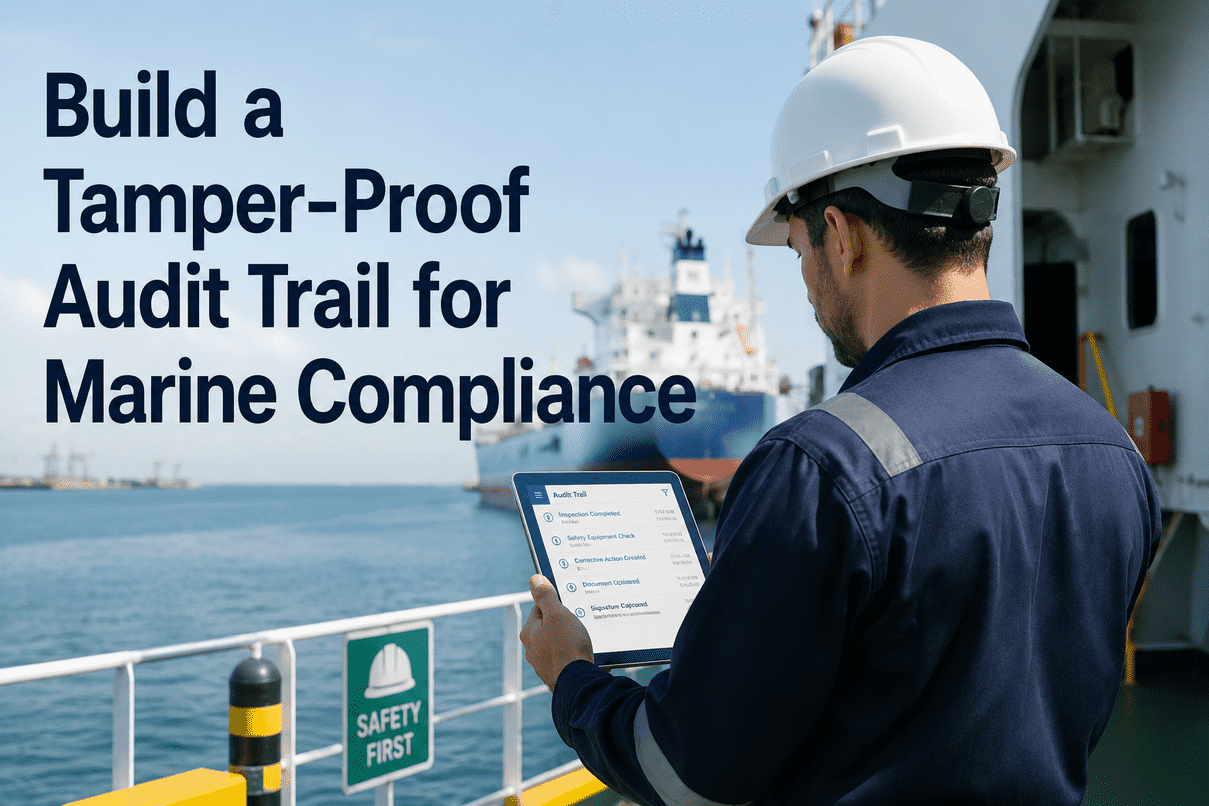
If your vessel receives a D rating for three consecutive years or an E rating in any single year, you must submit a corrective action plan as part of SEEMP Part III. This isn't optional — it's a regulatory requirement that flag states and PSC officers verify. Sign up for Marine Inspection to manage corrective action plans with documented evidence across your fleet.

1
Identify Root Causes
Analyze why the vessel scored poorly — high-fouling hull, excessive port time, ballast-heavy trade patterns, older engine efficiency, or suboptimal speed profiles. Use verified DCS data, not estimates.
2
Set Numeric Targets
Define a specific CII target (e.g., reduce from 15.0 to 13.8 gCO2/t-nm) and timeline. Show mathematically how proposed measures stack to reach a C rating or above.
3
List Measures with Expected Impact
Two pillars: technical upgrades (hull cleaning, propeller optimization, ESDs) with CAPEX and expected gCO2/t-nm reduction, and operational measures (speed profiles, JIT arrivals, trim control) with fuel savings.
4
Monitor and Report
Track progress quarterly — not just annually. Compare actual CII trajectory against target. Document all data sources: BDNs, flow meter logs, noon reports, AIS-derived performance, and hull survey records.

CII's Commercial Impact in 2026

CII is no longer just a regulatory metric — it's a market signal. Here's how your CII rating affects your bottom line right now.

A / B Rated
Commercial Advantage
Greater charter appeal with ESG-sensitive charterers. Potential access to green financing and sustainability-linked loans. Lower port fees where incentive schemes exist. Stronger negotiating position on charter rates.
C Rated
Compliance Zone
Meets minimum requirements today — but marginal C ships fall to D as thresholds tighten ~2% annually. No penalties yet, but limited commercial differentiation. Must actively manage to maintain rating.
D / E Rated
Commercial & Regulatory Risk
Corrective action plan mandatory. Increased PSC and flag state scrutiny. Reduced employment flexibility — charterers (especially energy majors) increasingly exclude D/E vessels. Asset value depreciation. Higher insurance costs.

CII Improvement Checklist

Use this to build your CII improvement strategy. These measures are ordered by implementation speed — start with zero-cost operational changes, then plan technical upgrades around your dry-dock schedule. Schedule a demo to see how Marine Inspection tracks each improvement measure's impact on your fleet CII.

CII Improvement — Action Plan Checklist
Immediate (Zero/Low Cost)
Implement speed optimization policy — match speed to CII target, not just schedule pressure
Activate weather routing for all voyages — track fuel savings per route decision
Coordinate JIT arrivals with ports — eliminate rush-to-wait fuel waste at anchor
Optimize trim for every voyage — verify ballast distribution matches optimal draft
Short-Term (1-6 Months)
Schedule underwater hull cleaning — document fouling level before/after with photos
Propeller polishing at next port opportunity — track RPM/speed ratio improvement
Calibrate fuel flow meters — data accuracy directly affects CII calculation reliability
Assign CII data owner (shore + ship) — quarterly reconciliation of fuel and AIS data
Next Dry-Dock
Apply low-friction hull coating — silicon/foul-release for 3-6% fuel reduction
Evaluate energy-saving devices — pre-swirl stators, propeller boss cap fins, wake ducts
Consider engine power limitation if applicable — EPL/ShaPoLi for EEXI + CII benefit
Assess wind-assist retrofit viability — rotor sails on suitable trade routes
Documentation & Reporting
SEEMP Part III current — includes 3-year CII improvement plan with specific targets
DCS data submitted by March 31 — fuel consumption, distance, hours underway verified
Statement of Compliance (SoC) kept onboard for 5 years with CII rating documented
Corrective action plan submitted if rated D (3 years) or E (1 year) — with evidence of measures

Frequently Asked Questions

What is CII and which ships does it apply to?
The Carbon Intensity Indicator measures how efficiently a ship transports cargo — expressed as grams of CO2 per cargo-carrying capacity per nautical mile. It applies to all ships above 5,000 GT on international voyages, including bulk carriers, tankers, container ships, gas carriers, Ro-Ro vessels, vehicle carriers, and cruise ships. Ships receive an annual rating from A (best) to E (worst).
What happens if my ship gets a D or E rating?
A ship rated D for three consecutive years or E in any single year must submit a corrective action plan as part of SEEMP Part III, showing how a C rating or above will be achieved. Beyond the regulatory requirement, D/E rated vessels face commercial consequences: reduced charter appeal, exclusion by ESG-sensitive charterers, increased PSC scrutiny, and potential asset value depreciation.
How can I improve my vessel's CII rating quickly?
The fastest improvements come from operational measures: speed optimization (5-15% fuel reduction), weather routing (3-5%), just-in-time arrivals (2-5%), and trim optimization (1-3%). These cost little to nothing and can be implemented immediately. For medium-term impact, hull cleaning (3-9% improvement) and propeller polishing (1-5%) deliver strong returns at moderate cost.
How do CII thresholds change each year?
Required CII tightens annually — reduction factors were 5% (2023), 7% (2024), 9% (2025), and 11% (2026) below the 2019 reference line. This means a vessel that scored C one year can become D the next without any operational change. Post-2026 reduction factors have been set by MEPC.400(83) and are expected to tighten further toward the 2030 target of 40% carbon intensity reduction.
Is CII just a compliance issue or does it affect commercial operations?
CII has become a commercial performance metric in 2026. A/B-rated vessels command stronger charter positions, qualify for green financing, and may receive port incentives. D/E-rated vessels face reduced employment flexibility, exclusion by energy majors, and higher financing costs. Classification societies like DNV and Lloyd's Register now recommend incorporating CII into asset valuation and capital allocation decisions.
Turn CII From Risk Into Competitive Advantage
Real-time CII tracking, fuel data management, hull maintenance documentation, corrective action workflows, and SEEMP Part III compliance — Marine Inspection gives fleet managers the tools to not just meet CII targets, but beat them.