The Carbon Intensity Indicator (CII) enforcement reality of 2026 is not theoretical. The SEEMP Part III revision deadline of 31 December 2025 has passed. Vessels that missed it now face flag state enforcement and PSC deficiencies. The 2026 CII reduction factor reaches 11 percent against the 2019 baseline. Clarksons Research estimates that approximately 50 percent of the global fleet would fall to D or E ratings by 2026 without operational modifications — primarily speed reduction adding 5 to 10 percent to voyage times. IMO Resolution MEPC.400(83) introduces stricter reduction factors of 12.5 percent for 2027, 14.5 percent for 2028, 18 percent for 2029, and 21.5 percent by 2030. A D rating for three consecutive years or a single E rating triggers a mandatory Corrective Action Plan under SEEMP Part III with submission required within one month of the annual DCS report. MARPOL Annex VI Regulation 28.7 makes the CAP a verification gate for the Confirmation of Compliance. Commercial impact extends beyond compliance — charterers reject D-rated vessels, financiers price climate risk into terms, and EU ETS coverage rises to 70 percent of shipping emissions in 2026. CII tracking software replaces post-hoc spreadsheet reconciliation with real-time CII trajectory per vessel, operational lever scenario modelling, SEEMP Part III implementation tracking, and CAP workflow integration. Book a 30-minute CII tracking demo to see your fleet's 2026 CII trajectory on real DCS data.
CII Tracking Software · 2026 Enforcement Reality
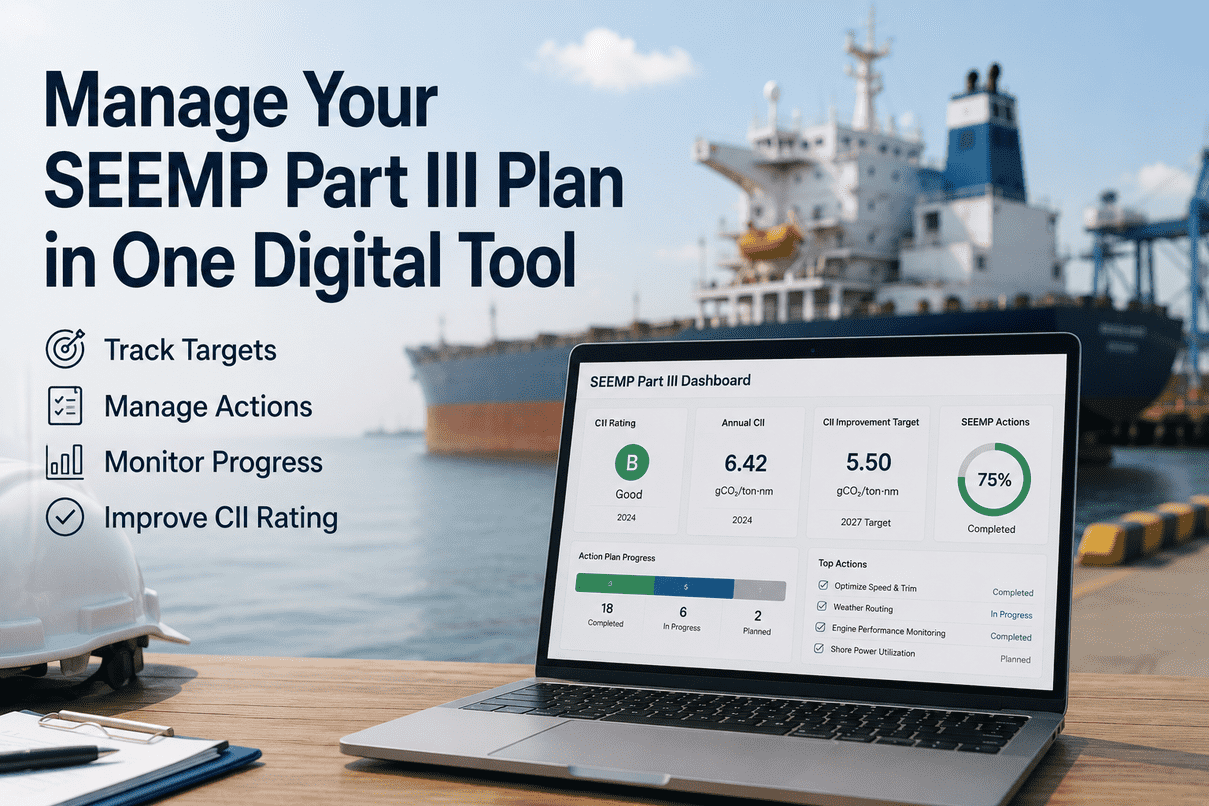
Real-Time CII Trajectory Per Vessel. Operational Levers Scored. CAP Workflow Built In.
Live AER calculation, MEPC.400(83) reduction factors, SEEMP Part III implementation tracking, operational lever scenario modelling, and Corrective Action Plan workflow — for the fleet operating under 2026 CII enforcement.
Fleet CII Snapshot · 24 Vessels · 2026 Reporting Year
7 Need CAP
C Rating target minimum
9 vessels · 37%
D Rating at risk
5 vessels · 21%
E Rating CAP required
2 vessels · 8%
M/V Pacific Star
D x 3 years
CAP DUE
M/V Northern Lights
E rated 2025
CAP OVERDUE
M/V Atlantic Bridge
Borderline C/D
MONITOR
7 vessels require CAP per MEPC.400(83) · 11% reduction effective 2026 · 70% EU ETS coverage
The CII Calculation Mechanics That Determine The Rating
The CII rating is not arbitrary — it is the output of a formula defined by IMO Resolution MEPC.336(76) with reduction factor updates per MEPC.400(83). Understanding the calculation is the first step to managing it. Five mechanics below define the calculation. Book a CII calculation demo to see live AER computation on your fleet DCS data.
M1
Annual Efficiency Ratio (AER)
CII for cargo and combination carriers calculated as AER — grams of CO2 emitted per deadweight tonne mile sailed in a calendar year. Total annual CO2 emissions divided by total annual transport work (DWT × NM). Reported via IMO Data Collection System.
M2
Required CII Per Vessel
Required CII calculated from the vessel's particulars (DWT, ship type) using reference line values from 2019 baseline data, then reduced by the year's reduction factor — 11 percent for 2026 against 2019 baseline. Each vessel has its own required CII.
M3
Attained CII From Actual Operations
Attained CII calculated from actual annual fuel consumption (per IMO DCS) and actual distance sailed. Includes correction factors for port time, ice navigation, and ship-to-ship operations per MEPC.355(78) guidelines.
M4
Rating Band Assignment
Attained CII compared to required CII produces rating A through E. A: significantly below required. B: below required. C: around required. D: above required by defined margin. E: significantly above required. Boundaries set per ship type.
M5
DCS Verification Cycle
Aggregated DCS data submitted by 31 March following the reporting year. Verifier (flag state or RO) checks data integrity. Attained CII and rating issued. Statement of Compliance (SoC) issued or withheld pending CAP for D x 3 or E vessels.
The 2023 To 2030 Reduction Factor Trajectory
IMO Resolution MEPC.400(83) adopted at MEPC 83 sets the CII reduction factor trajectory through 2030. The required annual operational CII tightens year over year against the 2019 baseline. Vessels that are borderline C-rated today may slip to D as the threshold tightens. The trajectory below is the planning horizon every operator must run scenarios against.
2023
5%
Initial reduction factor · First CII ratings issued · Voluntary phase pressure
2024
7%
First mandatory rating cycle complete · First D x 1 / E ratings appear · CAPs required
2025
9%
SEEMP Part III revision deadline 31 Dec 2025 · MEPC.400(83) factors locked
2026
11%
Current reporting year · PSC enforcement active · 50% fleet at D/E risk · EU ETS 70%
2027
12.5%
MEPC.400(83) new factor · First wave D x 3 CAPs · IMO mid-term GHG measures parallel
2028
14.5%
SEEMP Part III implementation midpoint · Mandatory progress review
2029
18%
Accelerated reduction · Many existing vessels structurally unable to maintain C
2030
21.5%
2030 trajectory target · Operational measures alone insufficient · Technology required
The CII Rating Bands Commercial Consequence Matrix
Each CII rating band carries specific commercial, regulatory, and financial consequences. Charterers, financiers, and PSC inspectors all read the same rating but with different downstream actions. The matrix below maps each band to its consequences across the four dimensions that matter. Mobile users scroll horizontally for the full view.
| Rating |
Regulatory Status |
Charterer View |
Financier View |
PSC Posture |
| A |
Superior performance · No action |
Premium charter rates available |
Sustainability-linked finance access |
Routine inspection only |
| B |
Above required · No action |
Preferred for ESG-conscious charters |
Standard finance terms |
Routine inspection only |
| C |
Compliant minimum · Monitor |
Acceptable for most charters |
Standard finance terms |
Routine inspection only |
| D (first year) |
Below required · No CAP yet |
Some charterer exclusion |
Risk premium applied |
Increased PSC scrutiny |
| D (second year) |
Below required · CAP planning |
Charter rate discount |
Refinancing difficulty |
Targeted PSC inspection |
| D x 3 years |
CAP mandatory · SEEMP Part III revision |
Charterer exclusion broadening |
Refinancing blocked |
CAP verification at PSC |
| E (single year) |
CAP mandatory · SoC withheld |
Major charterer exclusion |
Climate stress test failure |
CAP verification at PSC |
| E or D x 3 · No CAP |
SoC withdrawn · Non-compliant |
Charter market exclusion |
Loan covenant breach |
Detention risk |
The Six SEEMP Part III Mandatory Elements
SEEMP Part III is not optional documentation — it is the ship-specific, three-year implementation plan that operationalizes CII compliance. All approved SEEMP Part III plans required revision by 31 December 2025 to incorporate the MEPC.400(83) reduction factors for 2026-2028. Six mandatory elements define the content. Book a SEEMP Part III demo to see all six elements aligned on your fleet's actual planning data.
E1
Required CII For Next Three Years
Required CII for 2026, 2027, 2028 calculated based on each vessel's particulars (DWT, ship type) and the MEPC.400(83) reduction factors of 11%, 12.5%, 14.5% respectively. The required trajectory the vessel must meet.
E2
Target CII Per Operational Plan
Target CII for next three years calculated based on the vessel's planned operational measures. Target must be at or better than required. Target sets the internal benchmark separate from regulatory minimum.
E3
Implementation Plan Detail
Detailed implementation plan covering operational measures (speed optimization, weather routing, trim management), technical measures (hull cleaning, propeller polish, engine tuning), and management measures (crew training, performance monitoring) with timelines.
E4
Calculation Methodology
Methodology for CII calculation and reporting aligned with IMO standards. Data sources, correction factor application, voyage adjustment procedures, DCS integration. Verifier reviews methodology before SoC issuance.
E5
Monitoring And Self-Assessment
Procedures for monitoring CII performance continuously, conducting self-assessment quarterly or monthly, identifying performance drift, triggering operational adjustments before annual rating crystallizes.
E6
Corrective Action Plan If Applicable
If vessel received D x 3 years or E x 1 year rating, SEEMP Part III revised to include CAP with analysis of why required CII not met, corrective measures, implementation timeline, expected CII impact, target to achieve at least C rating.
The Operational Levers That Actually Improve CII Rating
CII improvement is not theoretical — it comes from specific operational, technical, and management interventions with measurable CII impact. Six levers below are the proven interventions operators apply. Each lever has a typical CII impact range, implementation cost, and time-to-effect. Book an operational lever modelling demo to see scenario modelling on your fleet.
L1
Speed Reduction (Slow Steaming)
The most powerful lever. Reducing service speed by 1 knot typically improves CII by 8-12%. Adds 5-10% to voyage time. Charter party permitting required. The primary lever for vessels facing D rating reality.
L2
Weather Routing Optimization
Avoiding adverse weather and currents through optimized routing. 3-8% CII improvement typical. Routing software integration. Per-voyage savings compound across the year.
L3
Trim And Draft Optimization
Operating at optimal trim and draft for actual loading condition. 2-5% CII improvement. Trim optimization software. Crew training on dynamic trim setting per voyage condition.
L4
Hull And Propeller Cleaning
Hull cleaning every 6-12 months and propeller polish at scheduled intervals. 3-6% CII improvement post-cleaning. Drydock-independent in-water hull cleaning increasingly used between drydockings.
L5
Engine Tuning And Optimization
Engine performance tuning, turbocharger optimization, injector calibration. 2-4% CII improvement. Often combined with engine overhauls. OEM service partnership required.
L6
Alternative Fuel Adoption
Biofuels, LNG, methanol blends. 15-30%+ CII improvement depending on fuel mix. Capital intensive. Fuel availability constraint. The structural lever for the 2027-2030 reduction trajectory.
The Improvement Lever Impact And Cost Matrix
The matrix below maps each operational lever to its typical CII impact, implementation cost, time-to-effect, and operational tradeoffs. Use it to model the realistic combination of levers required to move a vessel from D to C rating, or from C to B for charter premium access.
| Lever |
CII Impact |
Implementation Cost |
Time-To-Effect |
Key Tradeoff |
| Speed reduction 1 knot |
8-12% improvement |
Low (operational) |
Immediate |
+5-10% voyage time |
| Speed reduction 2 knots |
15-22% improvement |
Low (operational) |
Immediate |
+10-18% voyage time |
| Weather routing |
3-8% improvement |
$15K-$50K annual licence |
30 days from setup |
Routing flexibility required |
| Trim optimization software |
2-5% improvement |
$25K-$80K install |
60-90 days |
Cargo condition variability |
| Hull cleaning (in-water) |
3-6% post-clean |
$30K-$80K per clean |
Immediate post-clean |
Fouling re-accumulates |
| Propeller polish |
1-3% post-polish |
$10K-$30K per polish |
Immediate |
Diver / drydock required |
| Engine tuning |
2-4% improvement |
$40K-$150K |
30-90 days |
OEM service partnership |
| Engine power limitation (EPL) |
5-15% improvement |
$50K-$200K install |
30 days post-install |
Permanent speed cap |
| Shaft power limitation (ShaPoLi) |
5-12% improvement |
$80K-$300K install |
60 days post-install |
Reversible · class approval |
| Air lubrication system |
5-10% improvement |
$500K-$1.5M retrofit |
Drydock cycle |
Capital intensive |
| Biofuel B30 blend |
20-25% improvement |
+15-25% fuel cost |
Per bunker stem |
Fuel availability + cost |
| LNG dual-fuel conversion |
25-35% improvement |
$15M-$25M retrofit |
6-12 month drydock |
Capital + LNG infrastructure |
CII Tracking Demo · 30 Minutes · 2026 Enforcement Active
See Your Fleet's 2026 CII Trajectory Before The Next DCS Report
A 30-minute walkthrough with a Marine Inspection product expert. Bring one vessel's IMO DCS data and current SEEMP Part III. Walk through live AER calculation, MEPC.400(83) trajectory modelling, operational lever scenarios, CAP workflow if applicable, and the projection of 2026-2028 ratings against your real operational data.
The Corrective Action Plan Lifecycle That Restores Rating
A CAP is the SEEMP Part III amendment that operationalizes recovery from a D x 3 years or E rating. It is not optional documentation — MARPOL Annex VI Regulation 28.7 makes CAP submission a verification gate for the Confirmation of Compliance re-issuance. The lifecycle below defines the workflow every operator with D-trending or E-rated vessels must run. Book a CAP workflow demo to see Marine Inspection's CAP lifecycle on real fleet data.
Stage 01
Trigger Detection
Annual DCS data submitted by 31 March. Attained CII calculated. Rating issued. D x 3 years or E rating triggers CAP requirement. Trigger captured in audit trail.
Stage 02
Root Cause Analysis
Analysis of why required CII not met. Voyage-level decomposition of fuel consumption, distance, port time. Operational pattern identification. Technical condition assessment. Quantified gap to required CII.
Stage 03
CAP Drafting
Corrective measures specified with quantified CII impact. Implementation timeline. Owner per measure. Expected attained CII for next year. Target at least C rating. CAP integrated into SEEMP Part III revision.
Stage 04
Submission And Verification
CAP submitted within 1 month of annual DCS report. Verifier (flag state or RO) reviews CAP feasibility. Verification audit may be conducted. SoC re-issuance pending CAP acceptance.
Stage 05
Implementation Tracking
Measures implemented per timeline. Monthly progress tracking. Quarterly self-assessment. Performance monitoring against target trajectory. Adjustments if implementation falls behind plan.
Stage 06
Verification Of C Rating
Next year's DCS data shows attained CII at or below required CII. Rating moves to C or better. CAP verified as successful. Normal CII cycle resumed.
Marine Inspection's CII Tracking Architecture
Marine Inspection's CII layer is structured to handle the four operational realities of 2026 CII compliance — real-time AER calculation, multi-year trajectory modelling, SEEMP Part III implementation tracking, and CAP workflow. Four architectural layers handle the operational complexity. Book the CII architecture demo to apply the platform to your fleet. Start a free trial to evaluate before any contract.
Layer 1
Real-Time AER Calculation
Live AER calculation per vessel from voyage-level fuel consumption and distance data. Correction factors applied per MEPC.355(78) for port time, ice navigation, ship-to-ship transfers. Required CII calculated from MEPC.400(83) reduction factors. Rating projected forward.
Layer 2
Trajectory And Lever Modelling
Multi-year trajectory through 2030 against MEPC.400(83) reduction factors. Operational lever scenario modelling — speed reduction, weather routing, trim optimization, hull cleaning, engine tuning, alternative fuel adoption. Per-vessel impact quantified.
Layer 3
SEEMP Part III Implementation
Six mandatory elements tracked — required CII, target CII, implementation plan detail, calculation methodology, monitoring procedures, CAP if applicable. Progress monitoring monthly. Quarterly self-assessment. Audit pack assembly for verifier review.
Layer 4
CAP Workflow Engine
Six-stage CAP lifecycle — trigger detection, root cause analysis, CAP drafting, submission and verification, implementation tracking, verification of C rating. MARPOL Annex VI Regulation 28.7 + 28.8 alignment. Verifier review pack assembled.
Frequently Asked Questions
What is the Carbon Intensity Indicator and which vessels does it apply to?
The Carbon Intensity Indicator (CII) is the IMO operational measure of vessel CO2 emissions efficiency per cargo capacity and distance travelled. CII applies to ships of 5,000 gross tonnage and above engaged in international voyages. The CII rating runs A through E with A representing superior performance and E representing significantly above required CII. C is the regulatory minimum compliant rating. CII is calculated as the Annual Efficiency Ratio (AER) for cargo and combination carriers — grams of CO2 emitted per deadweight tonne mile sailed in a calendar year, computed from total annual CO2 emissions divided by total annual transport work (DWT multiplied by NM). Data is reported via the IMO Data Collection System (DCS) with aggregated annual DCS data submitted by 31 March following the reporting year. The verifier (flag state or Recognized Organization) checks data integrity, the attained CII and rating are issued, and the Statement of Compliance (SoC) is issued. CII operates alongside EEXI (Energy Efficiency Existing Ship Index, technical design measure), MARPOL Annex VI Chapter 4, and SEEMP Part III implementation planning.
What is the CII reduction factor trajectory through 2030?
IMO Resolution MEPC.400(83) adopted at MEPC 83 sets the CII reduction factor trajectory through 2030 against the 2019 baseline. 2023: 5% reduction factor as the initial mandatory year. 2024: 7% with the first mandatory rating cycle producing first D and E ratings. 2025: 9% with SEEMP Part III revision deadline at 31 December 2025. 2026: 11% — the current reporting year with PSC enforcement active and Clarksons Research estimating approximately 50% of the global fleet would fall to D or E ratings without operational modifications. 2027: 12.5% per MEPC.400(83) new factor. 2028: 14.5% with SEEMP Part III implementation midpoint. 2029: 18% with accelerated reduction making many existing vessels structurally unable to maintain C without technology adoption. 2030: 21.5% target where operational measures alone become insufficient and alternative fuels, energy efficiency technologies, and IMO mid-term GHG measures parallel become operational reality.
What happens if a vessel gets a D or E rating?
A vessel rated D for three consecutive years or E for one year triggers mandatory Corrective Action Plan (CAP) requirements under SEEMP Part III. MARPOL Annex VI Regulation 28.7 makes the CAP a verification gate for Confirmation of Compliance re-issuance. The CAP must be submitted with or no later than one month after reporting the attained annual operational CII based on annual DCS report. The CAP describes corrective actions to achieve at least a C rating for the calendar year following adoption of the CAP and ultimately the required CII. Beyond regulatory consequences, commercial impact extends substantially. Charterers reject D-rated vessels — particularly major oil major and commodity charterers with ESG mandates. Financiers price climate risk into terms — refinancing difficulty at D x 2 years and refinancing blocked at D x 3 years. PSC posture tightens — increased scrutiny at D first year, targeted inspection at D second year, CAP verification at PSC for D x 3 or E. Without CAP submission, the SoC is withdrawn and the vessel becomes non-compliant — charter market exclusion, loan covenant breach, detention risk.
What must SEEMP Part III contain?
SEEMP Part III is the mandatory ship-specific three-year implementation plan operationalizing CII compliance. All approved SEEMP Part III plans required revision by 31 December 2025 to incorporate MEPC.400(83) reduction factors for 2026-2028. Six mandatory elements define the content. Required CII for next three years (2026, 2027, 2028) calculated based on each vessel's particulars and the MEPC.400(83) reduction factors of 11%, 12.5%, 14.5% respectively. Target CII per operational plan calculated based on the vessel's planned operational measures with target at or better than required. Implementation Plan Detail covering operational measures (speed optimization, weather routing, trim management), technical measures (hull cleaning, propeller polish, engine tuning), and management measures (crew training, performance monitoring) with timelines. Calculation Methodology for CII calculation and reporting aligned with IMO standards. Monitoring and Self-Assessment procedures for continuous CII performance monitoring and quarterly or monthly self-assessment. Corrective Action Plan if vessel received D x 3 years or E x 1 year rating with analysis, corrective measures, implementation timeline, expected CII impact, target at least C rating.
What operational levers improve CII rating fastest?
Six operational levers move the CII needle measurably with quantified impact ranges. Speed reduction is the most powerful lever — reducing service speed by 1 knot typically improves CII by 8-12% with immediate effect, reducing by 2 knots improves by 15-22%, with the tradeoff of 5-10% or 10-18% voyage time addition respectively. Weather routing optimization improves CII by 3-8% through avoiding adverse weather and currents. Trim and draft optimization improves CII by 2-5% through operating at optimal trim for actual loading. Hull and propeller cleaning improves CII by 3-6% post-clean through reducing friction. Engine tuning and optimization improves CII by 2-4% through performance tuning, turbocharger optimization, injector calibration. Alternative fuel adoption (biofuels, LNG, methanol blends) improves CII by 15-30% or more depending on fuel mix though capital intensive. Engine Power Limitation (EPL) improves by 5-15% with permanent speed cap. Shaft Power Limitation (ShaPoLi) improves by 5-12% reversibly with class approval. Air lubrication systems improve by 5-10% as drydock-cycle retrofit. Biofuel B30 blend improves by 20-25% per bunker stem.
How does the CAP lifecycle work?
The CAP lifecycle runs six sequential stages. Stage 01 Trigger Detection — annual DCS data submitted by 31 March, attained CII calculated, rating issued, D x 3 years or E rating triggers CAP requirement. Stage 02 Root Cause Analysis — analysis of why required CII not met with voyage-level decomposition of fuel consumption, distance, port time and operational pattern identification, technical condition assessment, quantified gap to required CII. Stage 03 CAP Drafting — corrective measures specified with quantified CII impact, implementation timeline, owner per measure, expected attained CII for next year, target at least C rating, CAP integrated into SEEMP Part III revision. Stage 04 Submission And Verification — CAP submitted within 1 month of annual DCS report, verifier (flag state or RO) reviews CAP feasibility, verification audit may be conducted, SoC re-issuance pending CAP acceptance. Stage 05 Implementation Tracking — measures implemented per timeline, monthly progress tracking, quarterly self-assessment, performance monitoring against target trajectory. Stage 06 Verification Of C Rating — next year's DCS data shows attained CII at or below required, rating moves to C or better, CAP verified as successful, normal CII cycle resumed.
How does Marine Inspection's CII tracking work?
Marine Inspection's CII layer combines four architectural primitives. Layer 1 Real-Time AER Calculation — live AER calculation per vessel from voyage-level fuel consumption and distance data with correction factors applied per MEPC.355(78) for port time, ice navigation, ship-to-ship transfers, required CII calculated from MEPC.400(83) reduction factors, rating projected forward. Layer 2 Trajectory And Lever Modelling — multi-year trajectory through 2030 against MEPC.400(83) reduction factors with operational lever scenario modelling including speed reduction, weather routing, trim optimization, hull cleaning, engine tuning, alternative fuel adoption with per-vessel impact quantified. Layer 3 SEEMP Part III Implementation — six mandatory elements tracked including required CII, target CII, implementation plan detail, calculation methodology, monitoring procedures, CAP if applicable, with progress monitoring monthly and quarterly self-assessment, audit pack assembly for verifier review. Layer 4 CAP Workflow Engine — six-stage CAP lifecycle from trigger detection through verification of C rating with MARPOL Annex VI Regulation 28.7 + 28.8 alignment. 6-12 week deployment with free trial available before any commitment.
2026 CII Enforcement Active · 50% Fleet At D/E Risk
Stop Reading CII Ratings Six Months Late. Start Managing Trajectory In Real Time.
Five-mechanic CII calculation engine, eight-year reduction factor trajectory tracking, eight-row rating consequence matrix, six SEEMP Part III mandatory elements, six operational improvement levers, twelve-row lever impact matrix, six-stage CAP lifecycle, four-layer CII tracking architecture — all in one CII platform built for the 2026 enforcement reality. Book a 30-minute CII demo on your actual fleet DCS data.