The financial truth of running a commercial vessel in 2026 is that the bill arrives daily — whether or not the ship moves, whether or not it carries cargo, whether or not the charterer pays on time. Drewry's last published industry benchmark put average daily vessel operating costs around $7,474, with inflation pushing the number upward in every year since. A standard Panamax containership runs roughly $9 million per year in OPEX — about $25,000 every single day, rain or shine, against a backdrop of nine standardized cost heads, an EU ETS carbon obligation that became a 100% phase-in this year, and a charter market where voyage profitability variance can swing tens of thousands of dollars based on a single port delay or bunker price move. Yet most operators still track these costs the way airlines tracked routes in the 1980s: spreadsheet exports thirty days after the fact, monthly variance reports compiled from procurement emails and crew payroll runs, and voyage P&L statements assembled at year-end accounting close. A modern marine cost tracking system replaces this lag with a live financial picture: every line item against every vessel against every voyage in real time, with budget variance flagged the day it appears rather than the month after. Start a free trial of Marine Inspection to see how vessel-level cost tracking transforms portfolio-level decisions about deployment, drydock timing, and charter acceptance.
For CFOs · Fleet Finance · Commercial Managers
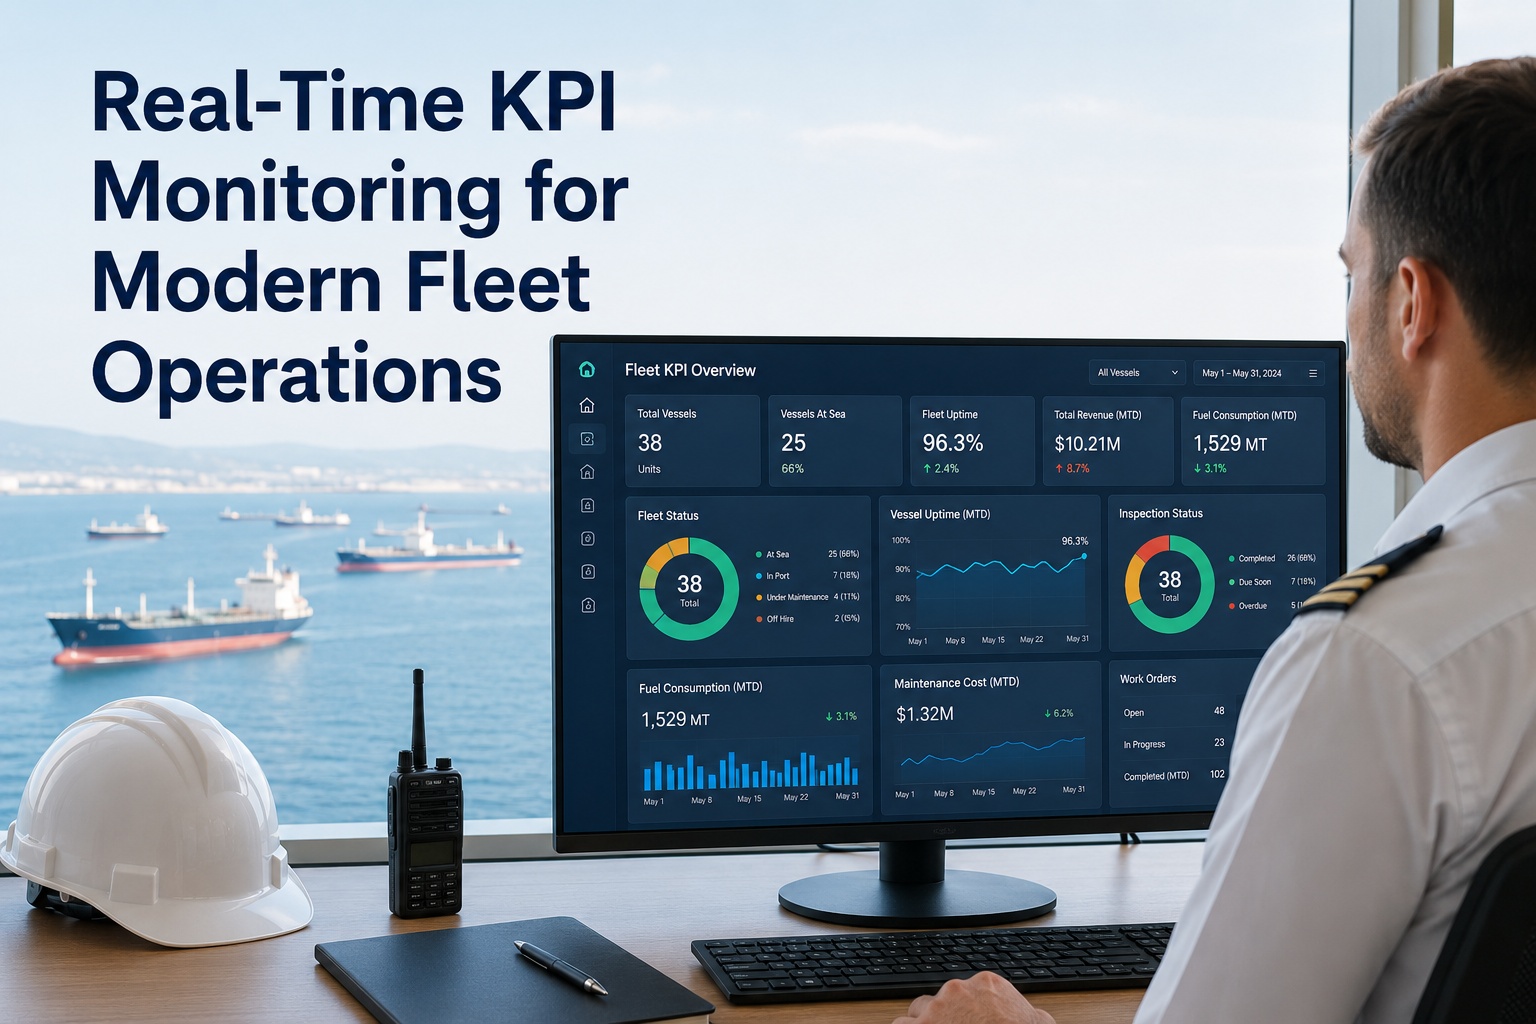
See Every Vessel's P&L in Real Time. Stop Discovering Last Month's Variance Next Month.
Daily OPEX tracking by vessel and cost head. Voyage P&L variance live. Charter ROI ranked across the fleet. Budget burn rate against Drewry industry benchmarks. One platform from purchase order to vessel-level profit.
Daily OPEX · Today
$24,840
M/V Pacific Star · Day 187 of charter
Insurance H&M / P&I
$3,726
Repairs & Maintenance
$3,478
Why Cost Visibility Lags 30-60 Days On Most Fleets — And What It Costs Operators
The structural reason most fleets fly partially blind on cost data is the assembly chain. A purchase order issued onboard moves through procurement to the supplier, who issues an invoice, which is matched to a delivery note, which is approved by a superintendent, which is posted to the accounting system, which is consolidated at month-end into a vessel cost report, which is reviewed in a finance meeting two weeks later. By the time the CFO sees that the M/V Pacific Star spent 22% over budget on lubricants in February, it is mid-April — and the next two months of consumption have already been ordered against the same flawed plan. The cost of this lag is rarely calculated, but it shows up everywhere: over-budget vessels not caught until the year is half-done, charter acceptances priced from stale OPEX data, drydock budgets that miss recent equipment-condition changes, and finance teams that spend more time reconstructing what happened than analyzing what to do next.
DELAY
30-60 Day Reporting Lag
Variances visible only after month-end accounting close. Two months of consumption already booked against flawed plan before correction.
SILOS
Procurement, Crewing, Finance Disconnected
Purchase orders in one system. Crew payroll in another. Insurance schedules in a spreadsheet. No single view of vessel-level spend until reconciliation.
STALE
Charter Pricing From Outdated OPEX
Commercial team prices new charters using last year's OPEX figures. Real cost trend masked. Margins erode silently across the next contract cycle.
BLIND
No Vessel-Level ROI Visibility
Fleet treated as a portfolio at year-end accounting only. No live ranking of which vessels earn, which break even, which bleed. Capital allocation guessed.
MANUAL
Variance Reports Hand-Compiled
Finance analysts spend days each month assembling vessel-by-vessel variance from disparate exports. Time spent on reconstruction, not analysis.
RISK
Audit-Trail Gaps
Approval emails. Spreadsheet justifications. Verbal sign-offs. Auditors and lenders ask for evidence trails the system cannot reproduce in a defensible form.
The Nine OPEX Cost Heads Every Modern Fleet Tracks Daily
Industry-standard vessel operating cost reporting follows a nine-line-item framework — the same structure used by Drewry's annual benchmark report, by major class societies, and by lenders evaluating fleet financial health. Real-time cost tracking maps every purchase order, payroll run, insurance premium, and survey invoice to one of these nine cost heads, producing benchmarkable, comparable, lender-ready vessel-level reporting without manual reconstruction. Book a Marine Inspection demo to see the nine-line OPEX framework live.
01
Crew Wages & Travel
Largest single OPEX line on most vessels — typically 35-45% of daily cost. Officer and rating salaries, travel for crew change, training, medical, repatriation, family support. Real-time tracking handles multi-currency payroll, manning agency variance, and crew-change cost spikes.
35-45%
02
Management Fees
Third-party technical management fees, in-house management overhead allocation, fleet-level shore staff cost. Typically expressed per vessel per month. Variance often signals scope creep in management agreements.
5-8%
03
Hull & Machinery Insurance
H&M annual premium tied to insured value, vessel age, claims history. Real-time tracking surfaces premium-vs-claims ratios that inform renewal negotiations and identify vessels carrying higher-than-average insurance load.
8-12%
04
P&I Insurance
Protection and Indemnity premium covering crew, cargo, pollution, and third-party liabilities. Renewals each February shape the year's run-rate. Tracked alongside H&M for total insurance load per vessel.
5-7%
05
Stores & Spares
Consumable stores, deck stores, engine stores, cabin stores, and spare parts inventory. Largest variance category — runaway spending here is the most common signal of weak procurement discipline or aging machinery. Trended weekly.
10-15%
06
Lubricants
Main engine cylinder oil, system oil, hydraulic oil, gear oil. Consumption is a leading indicator of engine condition — rising specific consumption often signals piston ring or liner wear. Tracked per running hour, not just total.
6-9%
07
Repairs & Maintenance
Planned and unplanned repair costs, contractor labor, port-based service work, riding crews. The variance category most sensitive to vessel age and condition monitoring maturity. Properly tracked, signals retrofit and drydock timing.
10-15%
08
Survey & Certification
Class society fees, statutory surveys, audit costs, certification renewals, vetting inspection fees. Predictable on schedule, but variance signals issues — extended surveys often indicate underlying compliance gaps.
3-5%
09
Drydocking (Amortized)
Five-year drydock cost amortized into daily rate. Real cost tracking compares planned amortization with actual drydock spend, identifying vessels that consistently exceed budget — typically signaling structural decline.
5-8%
OPEX, VOYEX, and CAPEX — The Three Cost Buckets Most Operators Mix Up
Cost tracking discipline starts with the right categorization. Operating costs (OPEX) run daily regardless of voyage activity. Voyage costs (VOYEX) vary trip-by-trip with route, port, and bunker decisions. Capital expenditures (CAPEX) are one-time investments amortized over asset life. Mixing these buckets makes vessel comparison meaningless and charter pricing dangerous. A modern cost tracking system enforces clean separation while presenting unified vessel P&L.
OPEX
Operating Expenses
Fixed daily costs to keep the vessel running — paid whether or not the vessel moves. Crew, insurance, management, stores, spares, lubricants, maintenance, surveys, drydock amortization. The owner bears these on a time charter.
Benchmark: ~$7,474/day Drewry 2022 baseline
VOYEX
Voyage Expenses
Variable per-voyage costs that rise and fall with each trip — bunker fuel, port charges, pilotage, tug fees, canal tolls, cargo handling, agency fees, and increasingly EU ETS allowance costs. The charterer typically bears these on a time charter.
Variable: 30-70% of total trip cost
CAPEX
Capital Expenditures
One-time investments amortized over asset life — newbuild cost, major retrofits (scrubbers, ballast water treatment, dual-fuel conversion, energy efficiency upgrades), and major equipment replacements. Driven by regulatory and competitive cycles.
Amortized: 15-25 year horizon
The Five Financial KPIs Modern Cost Tracking Surfaces Live
Cost tracking is not the same as accounting. Accounting reports what happened; cost tracking surfaces what to do next. The five financial KPIs below — each tracked continuously rather than monthly — are the difference between a finance system and a decision-support tool. Each one supports a specific commercial or capital decision.
DAILY OPEX
Daily Operating Cost Run Rate
Total OPEX expressed per day per vessel, refreshed continuously as purchase orders, payroll, insurance, and other costs hit the accounting system. Compared against budget, against prior period, and against Drewry industry medians for the vessel type.
Used for: charter pricing, budget variance alerts, fleet ranking
VOYAGE P&L
Dynamic Voyage Profit & Loss
Voyage P&L that updates with each vessel action and operator decision — fuel taken, port delay, schedule change, EU ETS allowance accrual, demurrage exposure. Reveals drivers of estimate-to-actual variances mid-voyage rather than at settlement.
Used for: voyage execution decisions, claim positioning, charter performance
TCE
Time Charter Equivalent
Net daily earnings after voyage costs (bunker, port, canal) — the standardized metric for comparing voyage profitability across different charter structures and routes. Calculated continuously as voyage data flows in, not retrospectively at settlement.
Used for: route comparison, market positioning, broker negotiations
COST/MILE
Cost Per Nautical Mile
Total operating and voyage cost divided by nautical miles steamed. Surfaces hull and propeller condition trends, slow-steaming economics, and route efficiency comparisons. Trended over rolling periods to filter out single-voyage noise.
Used for: hull cleaning ROI, speed policy, route comparison
VESSEL ROI
Vessel Return on Investment
Net earnings against asset value and capital deployed. Ranks vessels portfolio-style — which assets earn their keep, which break even, which are candidates for sale, retrofit, or repositioning. Updates as charter market shifts.
Used for: capital allocation, fleet renewal, sale-and-purchase decisions
How a Modern Cost Tracking System Compares to Spreadsheet and Generic ERP Approaches
Three baseline approaches compete with purpose-built marine cost tracking. Each has structural limitations that surface as soon as a fleet grows past a handful of vessels. Scroll horizontally on mobile to see the full comparison.
| Capability |
Spreadsheet-Based |
Generic ERP |
Marine Cost Tracking |
| Vessel-level P&L visibility |
Monthly compilation |
Cost-center mapping required |
Real-time per vessel |
| OPEX nine-line standard mapping |
Manual category coding |
Generic chart of accounts |
Pre-configured marine standard |
| Voyage P&L tracking |
Post-voyage reconstruction |
Not natively supported |
Dynamic, updates per action |
| EU ETS allowance accrual |
Quarterly true-up |
Manual carbon module |
Per-voyage live calculation |
| Drewry benchmark comparison |
Annual exercise |
Not built-in |
Auto-comparison per cost head |
| Purchase order to vessel cost |
Manual mapping |
PO module + GL coding |
Auto-posted as committed cost |
| Crew payroll integration |
Separate Excel |
HR module + integration cost |
Native crewing module |
| Budget variance alerts |
Manual review at month-end |
Generic threshold alerts |
Vessel-level real-time triggers |
| Vessel ROI ranking |
Pivot table exercise |
Custom report build |
Live fleet-wide dashboard |
| Lender / auditor evidence pack |
Reconstructed on request |
Partial via reports module |
One-click immutable evidence |
| Multi-currency handling |
Manual conversion |
Standard ERP capability |
Native — fleet often runs 5+ currencies |
| Implementation timeline |
Already built (limited) |
9-18 months typical |
10-12 weeks for mid fleet |
Stop Managing a Fleet From Last Month's Numbers
Real-time vessel cost tracking turns a 30-60 day reporting lag into same-day visibility — and turns finance teams from reconstructors into analysts. Marine Inspection delivers the nine-line OPEX framework, dynamic voyage P&L, EU ETS integration, and fleet ROI ranking on one platform.
The Six Data Sources That Feed Real-Time Cost Tracking
Real-time vessel cost tracking is only as accurate as its data feeds. The six sources below cover the practical envelope for commercial fleets. Each must integrate via API or direct database connection — manual exports break the real-time promise.
A
Procurement & Purchase Orders
Every purchase order, requisition, and supplier invoice. Auto-coded to vessel and cost head. Powers stores, spares, repair, and maintenance KPIs in real time.
B
Crew Payroll & Manning
Officer and rating salaries, travel costs, agency fees, training, medical. Integrates with crewing module to auto-post wages and travel expense.
C
Insurance & Class Society
H&M and P&I premium schedules, class society fee schedules, statutory survey costs. Annual amounts allocated daily for true daily run-rate.
D
Voyage & Bunker Data
Bunker delivery notes, port disbursement accounts, agency invoices, canal tolls, pilotage. Powers VOYEX line items and voyage P&L variance.
E
Charter & Revenue Contracts
Charter party terms, hire rate, off-hire events, demurrage, revenue invoicing. Provides the income side of vessel-level P&L calculation.
F
Carbon & Compliance APIs
EU ETS allowance prices, FuelEU compliance balance, EUA inventory positions. Live carbon-cost integration into voyage P&L per the 2026 100% phase-in.
Five Workflows That Turn Cost Data Into Earnings Decisions
Cost tracking does not generate value by visualization alone. The value comes from the specific decisions the data enables. Each of the five workflows below corresponds to a real commercial action that finance teams report as the highest-leverage outcome of cost tracking maturity.
01
Charter Acceptance Pricing
Commercial team prices new charter offers using current vessel-specific OPEX rather than fleet averages or last-year figures. Real-time daily run rate becomes the floor under the rate negotiation, with margin protection visible per vessel.
02
Mid-Voyage Variance Intervention
Voyage P&L flags estimate-to-actual variance during the voyage rather than after. Operations team can intervene — bunker stem adjustment, route change, port acceleration — while there is still time to defend voyage profitability.
03
Procurement Discipline at Source
Stores and spares cost trending live by vessel surfaces over-spending vessels in the moment. Procurement team coaches at source rather than reviewing variance reports two months after the spend already happened.
04
Insurance Renewal Negotiation
Per-vessel claims-vs-premium ratios surface vessels carrying disproportionate insurance load. CFO walks into renewal discussions with line-by-line evidence rather than aggregate fleet statistics. Premium relief becomes negotiable on data.
05
Capital Allocation Discipline
Vessel ROI ranking surfaces underperforming assets quarterly rather than annually. Capital flows to vessels earning their keep; redeployment, retrofit, or sale decisions made earlier and on better data.
The ROI Math For Marine Cost Tracking Software
Cost tracking platforms generate measurable returns through several compounding dimensions. The numbers below are conservative and consistent with fleet operator case studies from 2024-2026. Payback for mid-size fleets typically runs 9-12 months on the platform investment alone — before counting upside from improved capital allocation decisions.
3-7%
OPEX Reduction
Achievable through tighter procurement discipline, real-time variance intervention, and vessel-level coaching — measurable across 12-18 months of data.
$1,200
Per Voyage Bunker Saving
Industry-reported average from AI-driven bunker optimization tools integrated with cost tracking platforms — multiplied across fleet voyages.
30-60
Days Reporting Lag Eliminated
From month-end accounting compilation cycle to same-day visibility. The lag elimination is the first-order benefit; the savings compound from there.
3-5 days
/Month Saved On Variance Reports
Per finance analyst per month — time previously spent reconstructing vessel-level variance from disparate exports redirected to actual analysis.
9-12 mo
Typical Payback
For mid-size fleets (10-30 vessels) deploying integrated cost tracking. Larger fleets typically see faster absolute payback as the savings scale with fleet size.
Implementation Roadmap — From Decision to Live Cost Tracking in 10-12 Weeks
Marine cost tracking deployment is faster than enterprise ERP because the data model is purpose-built for vessel operations rather than retrofitted. Most mid-size fleets reach productive use within 10-12 weeks of decision, with phased onboarding by vessel cohort.
Wk 1-2
Chart of Accounts & Cost Heads
Map existing chart of accounts to nine-line OPEX standard. Configure vessel cost centers. Define VOYEX categories. Set up multi-currency handling. Lock the data structure before integration begins.
Wk 3-5
Procurement & Crewing Integration
PO data feed from procurement system. Crew payroll integration. Insurance schedule loading. Class society fee calendar. Pilot vessel data flowing live with calibration against historical periods.
Wk 6-8
Voyage P&L & Carbon Module
Charter party terms loaded. Voyage P&L engine configured with bunker, port, canal, and EU ETS allowance accrual. Voyage estimate-to-actual variance reporting live for pilot vessel.
Wk 9-12
Fleet Rollout & Routine
Phased onboarding of remaining fleet. Daily review cadence established for finance, commercial, and ops teams. First end-of-month close run on real-time data rather than reconstruction. Lender and audit evidence packs validated.
Why Marine Inspection For Marine Cost Tracking
Marine Inspection delivers vessel-level cost tracking on the nine-line OPEX framework that lenders, class societies, and Drewry use as the industry standard — with dynamic voyage P&L, EU ETS allowance integration, and fleet ROI ranking in one platform built for marine specifically. Procurement, crewing, insurance, and voyage data feed the same vessel cost view through native modules and APIs. Book a live demo for finance teams or start a free trial to see the platform on real fleet data within weeks.
01
Nine-Line OPEX Framework Pre-Built
Crew, management, H&M, P&I, stores, lubricants, repairs, surveys, drydock — pre-configured cost heads matching Drewry, lender, and class society conventions. No chart-of-accounts retrofit project required.
02
Dynamic Voyage P&L Engine
Voyage P&L updates with each operational decision — bunker taken, port delay, schedule change, EU ETS allowance accrual. Estimate-to-actual variance visible mid-voyage rather than at settlement.
03
EU ETS & FuelEU Integrated
Per-voyage EUA accrual at 100% phase-in. FuelEU compliance balance tracked live. Carbon expense flows into voyage P&L automatically rather than booked at year-end true-up.
04
Drewry Benchmark Comparison Built In
Each vessel's cost heads automatically benchmarked against Drewry-style industry medians for the vessel type and age. Variance from benchmark surfaces underperforming or over-budget vessels for portfolio review.
05
Procurement-to-Vessel Auto-Posting
Every PO, every payroll run, every insurance premium auto-posts as committed cost against the relevant vessel and cost head. Manual data entry eliminated. Audit trail immutable.
06
Lender & Auditor Evidence Pack
One-click evidence pack with vessel-level P&L, full approval audit trail, supplier documentation, and benchmark variance. Refinancing conversations and annual audits shift from reconstruction to review.
Run 2026 With Real-Time Vessel-Level P&L
Nine-line OPEX framework, dynamic voyage P&L, EU ETS at 100% phase-in, Drewry benchmark comparison, procurement-to-vessel auto-posting, lender evidence pack — all in one platform built for marine finance teams. 10-12 week deployment, 9-12 month payback. Book a demo or start a free trial today.
Frequently Asked Questions
What's the difference between OPEX, VOYEX, and CAPEX?
OPEX (Operating Expenses) are the fixed daily costs to keep a vessel running, paid whether the vessel moves or sits idle — crew wages, insurance, management fees, stores, spares, lubricants, maintenance, surveys, and drydock amortization. VOYEX (Voyage Expenses) are variable per-voyage costs that rise and fall with each trip — bunker fuel, port charges, pilotage, tug fees, canal tolls, cargo handling, and EU ETS allowance costs. CAPEX (Capital Expenditures) are one-time investments amortized over asset life — newbuild costs, major retrofits like scrubbers or ballast water treatment, dual-fuel conversions. Mixing these buckets makes vessel comparison meaningless and charter pricing dangerous. Modern cost tracking systems enforce clean separation while presenting unified vessel P&L.
What is the standard nine-line OPEX framework?
The industry-standard vessel operating cost framework used by Drewry's annual benchmark report, major class societies, and lenders evaluating fleet financial health: (1) crew wages and travel; (2) management fees; (3) hull and machinery insurance; (4) P&I insurance; (5) stores and spares; (6) lubricants; (7) repairs and maintenance; (8) survey and certification; and (9) drydocking amortized over the five-year cycle. Real-time cost tracking maps every purchase order, payroll run, insurance premium, and survey invoice to one of these nine cost heads, producing benchmarkable, comparable, lender-ready vessel-level reporting without manual reconstruction.
What does daily vessel OPEX typically run?
Drewry's last published industry benchmark put average daily vessel operating costs around $7,474 in 2022, with inflation pushing the number upward in subsequent years. The figure varies substantially by vessel type and size — a standard Panamax containership runs roughly $9 million per year in OPEX, about $25,000 per day, while smaller specialized vessels can run lower. Real-time cost tracking compares each vessel's actual daily run-rate against industry medians for the vessel type and age, surfacing both vessels running tight and vessels over-spending the benchmark.
What is dynamic voyage P&L?
Dynamic voyage P&L is voyage profit-and-loss tracking that updates with each vessel action and operator decision rather than being calculated retrospectively at voyage settlement. Bunker taken, port delays, schedule changes, EU ETS allowance accrual, demurrage exposure — all flow into the live P&L calculation. This enables operators to quantify estimate-to-actual variance mid-voyage and intervene to defend profitability, rather than discovering the variance after the voyage closed and the result is locked in. The shift from settlement-time to real-time P&L visibility is one of the highest-leverage capabilities cost tracking platforms deliver.
How does EU ETS factor into vessel cost tracking in 2026?
EU ETS coverage of maritime emissions reached 100% phase-in in 2026 — operators must surrender EU Allowances (EUAs) covering all eligible emissions, including methane (CH₄) and nitrous oxide (N₂O). EUA cost is now a first-order voyage line item rather than a year-end true-up. ETS surcharges are explicitly built into freight contracts; the cost-tracking system must calculate per-voyage EUA accrual in real time, track EUA inventory positions, handle cash and allowance settlement under contracts, and surface ETS exposure in voyage P&L. Operators without real-time ETS integration discover allowance shortfalls at quarterly true-up rather than during the voyages where commercial intervention was still possible.
What ROI do operators report from cost tracking software?
Operators with mature cost tracking report 3-7% OPEX reduction within 12-18 months through tighter procurement discipline, real-time variance intervention, and vessel-level coaching. AI-driven bunker optimization integrated with cost tracking platforms saves an industry-reported average of $1,200 per voyage. Reporting lag drops from 30-60 days to same-day visibility. Finance analysts recover 3-5 days per month previously spent on variance report assembly. Typical payback for mid-size fleets (10-30 vessels) is 9-12 months on platform investment, with larger fleets seeing faster absolute payback as savings scale with fleet size. Upside from improved capital allocation decisions — earlier identification of underperforming vessels, better-priced charter acceptance — typically exceeds the direct OPEX savings over multi-year horizons.
How does cost tracking integrate with existing accounting systems?
Best-practice marine cost tracking sits alongside the corporate accounting system rather than replacing it. The cost tracking platform ingests data from procurement (purchase orders), crewing (payroll), insurance (premium schedules), voyage operations (bunker, port, agency), and charter contracts via APIs. Vessel-level cost data syncs to the corporate GL through scheduled posts. Multi-currency handling is native — fleets often run 5+ currencies between flag, charter, supplier, and crew. The architecture preserves the corporate accounting system as system of record for statutory reporting while delivering operational vessel-level P&L visibility the corporate system was never designed to support.
How does Marine Inspection deliver cost tracking specifically?
Pre-configured nine-line OPEX framework matching Drewry industry standard. Dynamic voyage P&L engine with bunker, port, canal, and EU ETS allowance integration. FuelEU compliance balance tracked live. Drewry-style benchmark comparison built in for vessel type and age. Procurement-to-vessel auto-posting eliminates manual data entry. Crew payroll module integrated. Multi-currency handling native. Lender and auditor evidence packs generated on one click with full approval audit trail. Vessel ROI ranking dashboard for portfolio-level capital decisions. 10-12 week deployment for typical mid-size fleets. Book a live demo with finance teams to evaluate against your fleet operation, or start a free trial to validate the data model before commitment.