The fleet operator who walks into 2026 without real-time KPI monitoring is walking into a year where EU ETS now covers 100% of eligible emissions, FuelEU Maritime begins active enforcement with the first compliance balance approval deadline of 30 April 2026, and IMO fuel data collection has become more granular as of 1 January 2026 — all on top of the persistent operational truth that every minute of unplanned vessel downtime, every percent of fuel drift versus baseline, every overdue critical inspection, and every tonne of unaccounted CO₂ is now a measurable, billable, and reportable line item. The era when a monthly noon report and a pile of spreadsheets could pass for a fleet performance system is over. Real-time KPI monitoring software replaces the spreadsheet with a single live operating picture: vessel uptime, fuel use, inspection status, and revenue tracked continuously, surfaced through alerts when a metric crosses a threshold, and routed to the person who owns the response. Start a free trial of Marine Inspection to see what real-time fleet KPI monitoring looks like for tankers, OSVs, dry bulk, RoRo, and mixed fleets.
Real-Time Fleet KPI Monitoring · 2026
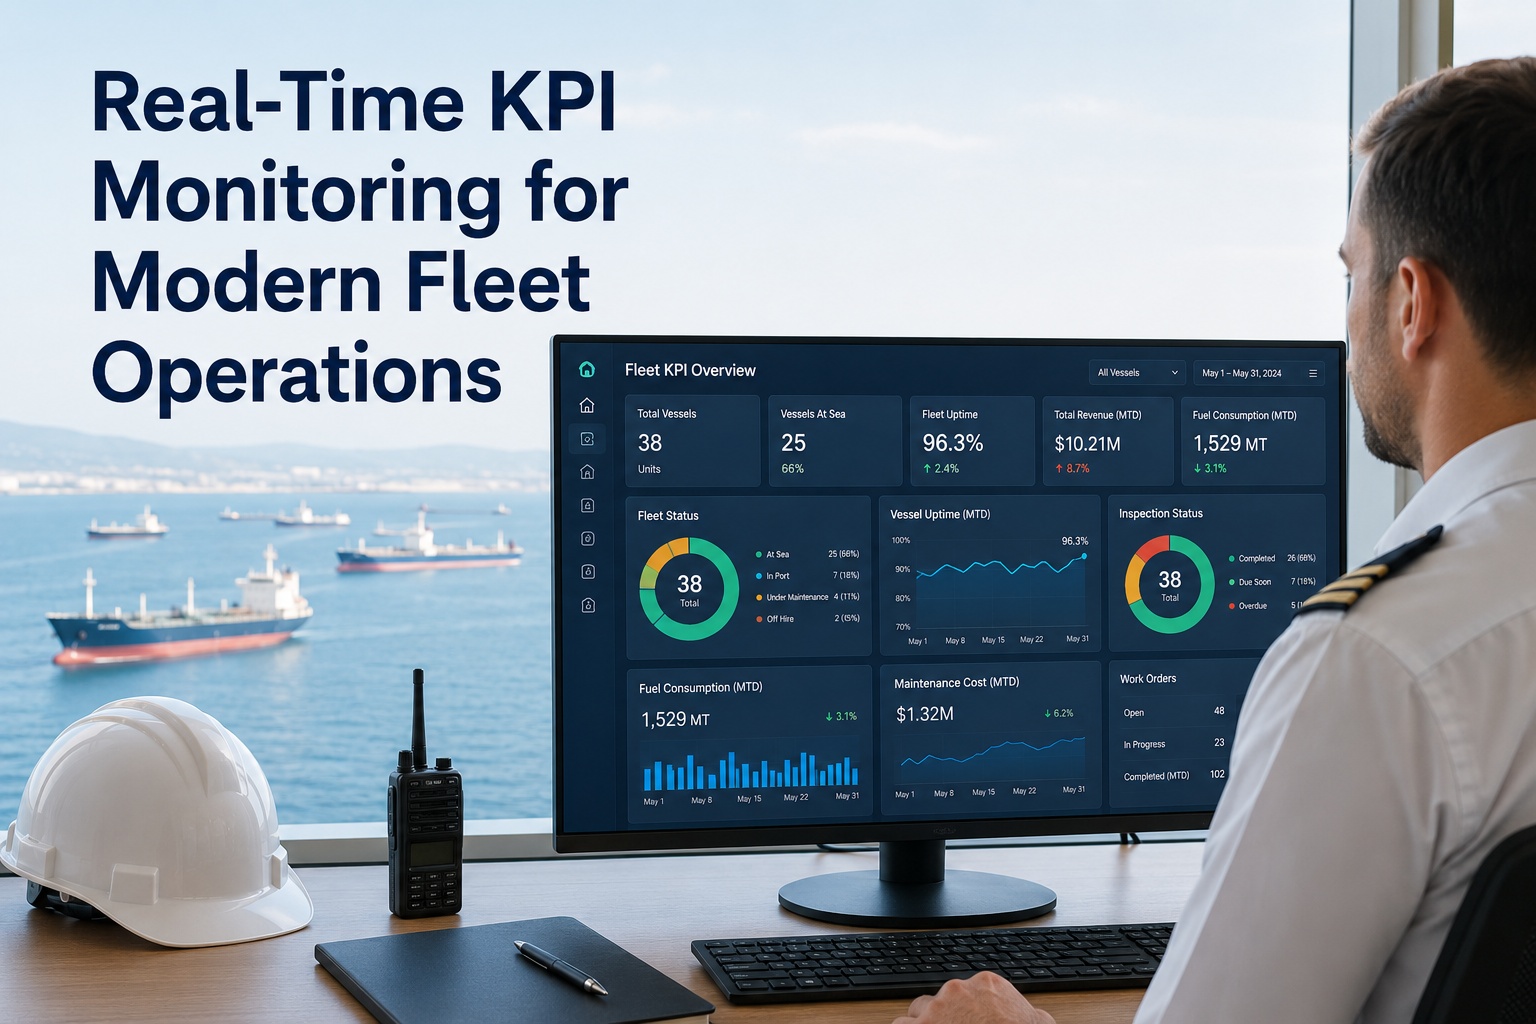
Track Every Vessel KPI in Real Time. Uptime. Fuel. Inspection. Revenue.
A single live dashboard replacing noon reports, spreadsheets, and end-of-month surprises. Eight to twelve KPIs that trigger workflows, assigned owners for each trigger, evidence trail audit-ready for FuelEU and EU ETS compliance.
Fleet Status — Live
Fuel Drift vs Baseline
12 vessels nominal
OK
Port Time Loss
2 vessels above target
CHECK
Overdue Critical Maintenance
1 vessel · 4 work orders
ACT
FuelEU Compliance Balance
YTD on track
OK
Why Real-Time Became Non-Negotiable in 2026
Three regulatory shifts converged at the start of 2026 to turn real-time data from a nice-to-have into operational baseline. Each one penalizes operators who rely on monthly reporting cycles and rewards operators who run continuous monitoring with audit-grade evidence trails. The cost of NOT seeing your KPIs in real time has become quantifiable in invoices.
JAN 2026
More Granular IMO Fuel Data Collection
From 1 January 2026, IMO Data Collection System (DCS) reporting under MARPOL Annex VI requires more granular fuel data — fuel type, voyage segmentation, and detailed consumption breakdowns no longer aggregable at month-end. Real-time data capture is the only practical path to compliant submissions.
EU ETS
100% Phase-In Reached in 2026
EU ETS coverage rose from 40% (2024) to 70% (2025) to 100% in 2026. Operators must surrender EU Allowances (EUAs) covering all eligible emissions, with methane (CH₄) and nitrous oxide (N₂O) now included. ETS surcharges are explicitly built into freight contracts.
FUELEU
First Active Enforcement Year
First FuelEU Maritime report submission to verifier due 31 January 2026 covering 2025 data. Compliance balance approval in the FuelEU Maritime database due 30 April 2026. Document of Compliance on board and penalty payment deadline 30 June 2026.
CII
Carbon Intensity Indicator Active
CII rates ships A-E based on grams of CO₂ per transport work. D-rated vessels for three consecutive years or E-rated for one year require corrective action plans. Real-time tracking lets operators course-correct mid-year rather than discover a downgrade at year-end.
The Four Real-Time KPI Categories Every Maritime Dashboard Must Cover
Industry guidance for 2026 is consistent: pick 8 to 12 KPIs that trigger actions, assign an owner to each trigger, keep a short evidence trail, and remove anything that does not change a decision. The four categories below — uptime, fuel, inspection status, and revenue — are the spine of every well-designed real-time fleet dashboard. Each category has 4-6 KPIs that consistently earn their dashboard slot. See a live walkthrough of the full KPI library configured for your vessel mix.
Uptime & Availability
The vessel is earning when it is moving, loading, or discharging. Every other state is a cost.
Vessel Availability %
Hours available for charter divided by hours in period. Real-time deductions for breakdowns, off-hire, and unplanned repairs.
Mean Time Between Failures (MTBF)
Average operating hours between equipment failures by asset class. Trending upward = predictive maintenance working.
Planned Maintenance Compliance %
Work orders closed on time versus scheduled. Below 90% triggers superintendent escalation.
Critical Spare Parts Availability
Stock-out alerts on parts flagged as critical to vessel operation. Late-night sailing nightmares prevented.
Port Time Loss
Hours in port above the planned port stay envelope. Driver of demurrage exposure and revenue erosion.
Owner: Technical Superintendent
Fuel & Emissions
Fuel is the largest variable cost. Emissions are now a billable obligation. Both demand continuous tracking.
Specific Fuel Oil Consumption (SFOC)
Grams of fuel per kWh of engine output. Direct indicator of engine condition and load efficiency.
Fuel Per Nautical Mile (kg/Nm)
Whole-vessel fuel efficiency including hull, weather, and operational variables. Real-time deviation from baseline = drift alarm.
CII Rolling Score
Year-to-date carbon intensity tracked continuously rather than calculated at year-end. Course-correction window stays open.
EU ETS / FuelEU Compliance Balance
Live tally of EUAs required and FuelEU compliance balance versus target. Cost exposure in real currency, not theoretical.
Hull & Propeller Performance
Speed-power curve drift since last drydock or hull cleaning. Triggers cleaning ROI calculation when fuel cost exceeds cleaning cost.
Owner: Performance Manager / Energy Lead
Inspection & Compliance
A clean PSC profile is worth millions in avoided detentions, charter premiums, and insurance terms.
Open Defect Count by Severity
Critical, major, minor open defects by vessel. Critical-tier defects trigger immediate shore notification with photo evidence.
Days to Defect Closure
Median and 90th-percentile time from defect logging to closure. Aged defects are a leading PSC detention indicator.
Certificate Validity Status
Days-to-expiry across all statutory certificates per vessel. Amber at 90 days, red at 30 days, escalation paths defined.
PSC / SIRE / Vetting Score
Most recent inspection scores and trend. Charterer-facing metric increasingly written into contracts.
Inspection Schedule Adherence
Daily, weekly, monthly captain inspections completed on time. Below 95% triggers DPA review.
Owner: DPA & Compliance Manager
Revenue & Commercial
A vessel is a revenue-generating asset. Commercial KPIs must sit alongside technical ones, not in a different dashboard.
TCE / Net Daily Earnings
Time charter equivalent calculated continuously rather than at voyage end. Charter performance versus market visible daily.
Voyage Profitability Variance
Actual versus budgeted voyage P&L. Bunker cost shocks, port delays, weather routing impacts surfaced in real time.
Off-Hire Hours
Hours billed to owner versus charterer. Unplanned breakdown hours have direct revenue cost. Trended monthly.
Demurrage Exposure
Predicted and actual demurrage by voyage. Real-time port-stay tracking surfaces exposure before final invoice.
ETS Cost Pass-Through
EUA cost recovered through freight terms versus borne by operator. Surfaces commercial gaps in EU ETS pass-through clauses.
Owner: Commercial Manager / Chartering Desk
The Workflow-Trigger Philosophy — If It Does Not Trigger Action, It Is Not a Dashboard
The single most important design principle for a real-time KPI dashboard separates the systems that earn their seat from the systems that are silently ignored. The principle is simple: if a KPI does not change someone's decision, it should not be on the main dashboard. Every metric must have a threshold, an alert, an owner, and a defined response. Without those four things, the metric is a report, not a dashboard.
1
Define Threshold
Each KPI gets a green/amber/red threshold tied to operational reality, not arbitrary targets. Fuel drift > 5% = amber. > 10% = red.
2
Real-Time Detect
Sensor data streams continuously. The moment a KPI crosses a threshold, the system flags the breach with timestamp and evidence.
3
Route to Owner
Alert routes to the named owner — superintendent, captain, performance manager. No "everyone gets the email" anti-pattern.
4
Defined Response
Each alert has a documented response playbook. Investigate, reroute, dispatch technician, escalate to DPA. No improvisation.
5
Evidence Trail
Action taken, timestamp, person, outcome — captured immutably. Audit-ready for FuelEU verifier, class society, or charterer.
TEST
The Superintendent Test
For every KPI on the dashboard, ask: when this number turns red, what does the superintendent do differently? If the answer is "nothing" or "I would have to look elsewhere first," the KPI fails the test and gets removed. The 8-12 KPIs that survive this test are the dashboard.
Static Reporting vs Real-Time Monitoring — What Actually Changes
The shift from monthly noon reports to continuous monitoring is not a UI upgrade. It changes which decisions are possible, on what timescale, and with what evidence. The capability comparison below summarizes the difference. Scroll horizontally on mobile to see the full table.
| Capability |
Noon Reports / Monthly |
Static Dashboard |
Real-Time KPI Monitoring |
| Data freshness |
24-hour to monthly latency |
End-of-day batch refresh |
Seconds to minutes from sensor |
| Fuel drift detection |
Identified at month-end review |
Found day-of, action next-day |
Alarm in 15 minutes, action same watch |
| FuelEU compliance balance |
Calculated at verifier audit |
Reconstructed from logs monthly |
Live YTD with course-correction window |
| EU ETS exposure tracking |
Quarterly true-up |
Monthly snapshot |
Real-time EUA accrual per voyage |
| CII trajectory awareness |
Year-end discovery |
Quarterly reset |
Rolling daily score with forecast |
| Defect-to-action latency |
Days via paper transcription |
Hours via batch sync |
Minutes via auto-routed alerts |
| Charter performance variance |
Voyage-end P&L surprise |
Weekly variance review |
Daily TCE versus market spread |
| Demurrage exposure visibility |
Final invoice surprise |
Mid-port discovery |
Forecast 24-48 hours pre-arrival |
| PSC readiness assurance |
Pre-arrival scramble |
Manual evidence assembly |
One-tap evidence pack continuously refreshed |
| Predictive maintenance signal |
None — calendar-based service |
Trend reports analyst-driven |
Sensor-driven anomaly alerts per asset |
| Voyage P&L confidence |
Backward-looking only |
Mid-voyage estimate |
Continuous live forecast with variances |
| Audit-grade evidence trail |
Reconstructed on request |
Partial, manually consolidated |
Immutable timestamped event log |
Stop Discovering Last Month's Problems This Month
Real-time monitoring closes the gap between data capture and decision-making from days to minutes. Marine Inspection delivers fleet-wide KPI tracking with workflow-trigger architecture, EU ETS and FuelEU compliance views, and audit-grade evidence trails. Book a demo to see your fleet's data on a live dashboard.
The Six Real-Time Data Sources Behind a Modern Fleet Dashboard
A real-time KPI dashboard is only as good as the data feeding it. The six sources below — each contributing different KPI categories — must be integrated through APIs rather than spreadsheet imports. Operators evaluating real-time monitoring software should verify integration depth with each source before signing.
A
AIS & Voyage Data
Position, speed, heading, ETA, port-stay duration. Powers utilization, demurrage exposure, port time loss, and arrival forecasting KPIs.
B
Engine & Sensor Telemetry
Mass flow meters for fuel, shaft torque, RPM, exhaust temperature, generator load. Powers SFOC, fuel-per-nautical-mile, hull performance KPIs.
C
CMMS / Maintenance Records
Work orders, defect logs, planned maintenance compliance, MTBF data. Powers uptime, planned maintenance compliance, and overdue critical maintenance KPIs.
D
Inspection & Certificate Database
Captain inspections, PSC results, SIRE 2.0 scores, certificate expiries. Powers compliance, defect closure, and inspection schedule adherence KPIs.
E
Commercial & Charter Systems
Charter party terms, voyage budgets, freight contracts, ETS pass-through clauses. Powers TCE, voyage profitability, and ETS cost recovery KPIs.
F
Emissions & Compliance APIs
EU MRV verifier feeds, IMO DCS submissions, FuelEU monitoring plan data, EUA prices. Powers compliance balance, CII trajectory, and ETS exposure KPIs.
Six Real-Time Workflows That Save Real Money
The dashboard is only the visible layer. Behind it sit a small number of automated workflows that turn metrics into action. Each of the six below pays back the dashboard investment on its own. Together they typically deliver 8-15% annual operating cost reduction for mid-size fleets within 12-18 months.
01
Fuel Drift Auto-Investigation
When kg/Nm exceeds baseline by 5%, the system auto-checks weather routing, hull condition trend, generator load, and fouling indicators. Performance manager receives a pre-investigated alert rather than a raw alarm — investigation time cut from hours to minutes.
02
Predictive Maintenance Trigger
Sensor anomalies (vibration, temperature, pressure) flag a deteriorating component before failure. Work order auto-generated. Spare parts requisition triggered. Operators report 30% reduction in unplanned repairs through this loop.
03
FuelEU Course Correction
YTD compliance balance drift triggers an alert when the trajectory points to a year-end shortfall. Operations team has the rest of the year to course-correct via biofuel bunkering or efficiency interventions, rather than discovering the gap at verifier audit.
04
Demurrage Exposure Forecast
Real-time port-stay tracking forecasts demurrage exposure 24-48 hours before final invoice. Commercial team can intervene with charterer, accelerate cargo operations, or document delay causes for laytime defense.
05
Critical Defect Auto-Routing
Captain logs critical-severity defect on mobile app. Within minutes: shore superintendent notified via push, work order generated, spare parts checked, technician dispatched if in range. Days-to-closure metric drops from 14 days to 4 days typical.
06
PSC Readiness Continuous Refresh
Evidence pack continuously refreshed: certificate validity, last inspections, defect closure history, drill records. PSC arrives, captain taps once, surveyor receives complete documentation. Detention risk reduced through clean evidence chain.
The ROI Math — Where Real-Time Monitoring Pays For Itself
Operators considering real-time KPI monitoring software typically scrutinize the business case. The numbers below are conservative and consistent across operator case studies. Book a demo with Marine Inspection to model your own ROI against your fleet's specifics.
8-15%
Annual Operating Cost
Reduction reported by operators with mature real-time monitoring within 12-18 months — combining fuel, maintenance, demurrage, and compliance savings.
30%
Unplanned Repair Reduction
Reduction in unplanned repairs achieved through sensor-driven predictive maintenance triggers, eliminating breakdown-driven downtime.
20%
VOC Reduction in 6 Months
Vessel operating cost reduction documented in published case study: real-time fuel monitoring plus predictive maintenance program rollout.
30 hrs
Per Vessel Per Year Saved
Reduction in time spent on emissions reporting and compliance evidence assembly when data flows through APIs rather than spreadsheets.
6-12 mo
Typical Payback
Time to recoup software investment for mid-size fleets (10-30 vessels) — fuel savings alone usually clear the bill, with maintenance and compliance gains as upside.
Implementation Roadmap — Ten Weeks to Live KPI Monitoring
Real-time fleet KPI monitoring is not a multi-year transformation program. With a clear scope, focused implementation team, and a software platform built for marine specifically (not adapted from generic IoT or BI tools), most mid-size fleets are running their primary KPIs live within 8-10 weeks. The four-phase roadmap below tracks against typical timelines.
Wk 1-2
Scope & KPI Definition
Workshop with operations, technical, commercial, compliance leads. Select 8-12 priority KPIs. Define thresholds, owners, response playbooks. Lock the dashboard scope before integration begins.
Wk 3-5
Data Source Integration
API connections to AIS, sensor telemetry, CMMS, inspection database, commercial system, emissions verifier. Pilot vessel data flowing live. Calibration against known historical periods to validate accuracy.
Wk 6-8
Workflow & Alert Configuration
Threshold tuning per KPI. Alert routing rules per owner role. Response playbook templates loaded. Pilot vessel runs full workflow loop with live alerts hitting real owners.
Wk 9-10
Fleet Rollout & Go-Live
Remaining vessels onboarded in batches. Training for shore-side and master users. First end-of-month review run on real-time data rather than noon reports. Fleet operating on live KPI dashboard.
Why Marine Inspection For Real-Time Fleet KPI Monitoring
Marine Inspection is built marine-native: every KPI category, every data source, every workflow trigger pre-configured for the patterns of tanker, OSV, dry bulk, container, RoRo, research, and mixed-fleet operations. Class society type-approved. EU ETS and FuelEU Maritime compliance views built in. Mobile-first captain capture feeding the same dashboard shore management runs. Book a demo or start a free trial to put your fleet's KPIs on a live dashboard within weeks, not quarters.
01
Marine-Native, Not Generic IoT Adapted
KPI library, data models, and workflow templates built around vessel operations — not retrofitted from industrial manufacturing tools. SFOC, kg/Nm, CII, FuelEU balance ready out of the box.
02
EU ETS & FuelEU Views Built In
100% phase-in EU ETS exposure tracking, FuelEU compliance balance with course-correction forecasting, IMO DCS submission support, CII rolling score — all live, all auditable.
03
API-First Architecture
Connects to AIS providers, sensor telemetry, existing CMMS, commercial systems, and EU MRV verifiers via APIs. No spreadsheet imports. No batch overnight ETL. Real-time means real-time.
04
Workflow-Trigger by Design
Every KPI has thresholds, owners, alerts, and response playbooks. Reports without action live in a separate analytics module. The main dashboard is operational, not informational.
05
Mobile + Shore Single Platform
Captain mobile app feeds the same dashboard shore management runs. No double entry. Defect captured at 0300 on deck appears on superintendent's screen by 0301.
06
10-Week Implementation
Live KPI monitoring within 10 weeks for typical mid-size fleets. No multi-year program. No back-office consulting engagement. Phased rollout with pilot vessel proven before fleet onboarding.
Be the Operator Running 2026 on Real-Time Data
EU ETS at 100%. FuelEU in active enforcement. IMO fuel data more granular than ever. The operators who will run 2026 efficiently are those who replaced the noon report with a live dashboard. Marine Inspection delivers it in 10 weeks. Book a demo to see your fleet's data live.
Frequently Asked Questions
How many KPIs should a real-time fleet dashboard show?
Industry guidance for 2026 is consistent: 8 to 12 KPIs is the sweet spot for the main dashboard. Fewer than 8 and the dashboard misses important categories. More than 12 and it becomes a wall of numbers that crew, masters, and superintendents stop checking. The discipline is to ask the superintendent test for every candidate metric: when this number turns red, what does the owner do differently? If the answer is "nothing" or "I would have to look elsewhere first," the KPI fails the test and gets removed. Detailed analytical metrics live in a separate drill-down view, not on the operational dashboard.
How is real-time monitoring different from existing noon-report systems?
Three differences matter. First, latency: noon reports lag 24 hours and aggregate to monthly cycles; real-time data flows in seconds to minutes. Second, granularity: noon reports give a single daily summary; real-time captures every voyage segment, every fuel switch, every load change. Third, action: noon reports are read; real-time data triggers automated workflows when thresholds are breached. From 1 January 2026, more granular IMO Data Collection System reporting effectively requires the granularity that real-time systems produce naturally — noon reports cannot meet the new data resolution requirements at month-end aggregation.
What does EU ETS 100% phase-in mean for fleet operators in 2026?
EU ETS coverage of maritime emissions stepped from 40% in 2024 to 70% in 2025 to 100% in 2026. Operators must surrender EU Allowances (EUAs) covering all eligible emissions: 100% of intra-EU voyages and at-berth emissions, plus 50% of voyages starting or ending outside the EU. From 2026, methane (CH₄) and nitrous oxide (N₂O) are also included in the scope. ETS surcharges are explicitly built into freight contracts, so visibility into per-voyage EUA exposure has become a commercial requirement, not just a sustainability metric. Real-time monitoring enables continuous tracking of EUA accrual rather than quarterly true-ups.
What are the key 2026 FuelEU Maritime deadlines?
Three FuelEU deadlines define 2026. First, by 31 January 2026, individual ship FuelEU reports for the 2025 reporting period must be submitted to an accredited verifier. Second, by 30 April 2026, the compliance balance must be approved in the FuelEU Maritime database. Third, by 30 June 2026, the FuelEU Document of Compliance must be on board and any penalty payments due must be made. Operators who lack real-time tracking of compliance balance discover shortfalls at the verifier audit stage with no remaining course-correction window. Real-time monitoring keeps the corrective intervention window open all year.
What ROI can mid-size fleet operators expect from real-time KPI monitoring?
Operators with mature real-time monitoring report 8-15% annual operating cost reduction within 12-18 months — combining fuel savings (typically the largest line item), maintenance cost reduction (often 30% reduction in unplanned repairs through predictive triggers), demurrage exposure mitigation, and compliance time savings (around 30 hours per vessel per year on emissions reporting alone). Published case study evidence cites 20% vessel operating cost reduction in six months from combined real-time fuel monitoring and predictive maintenance program rollout. Typical payback for mid-size fleets (10-30 vessels) is 6-12 months, with fuel savings usually clearing the software investment on their own.
How long does implementation typically take for a fleet of 15-25 vessels?
Eight to ten weeks for a typical mid-size fleet. Weeks 1-2 are scope and KPI definition with operations, technical, commercial, and compliance leads. Weeks 3-5 cover data source integration: AIS, sensor telemetry, CMMS, inspection database, commercial system, emissions verifier feeds. Weeks 6-8 are workflow and alert configuration with threshold tuning and response playbook loading. Weeks 9-10 are fleet rollout and go-live with vessels onboarded in batches and shore-side plus master training. Pilot vessel typically running live by week 5; full fleet on live dashboard by week 10. The compressed timeline depends on selecting marine-native software with pre-built KPI templates rather than building from generic IoT or BI platforms.
What data sources need to integrate with a real-time fleet KPI dashboard?
Six data sources cover the full KPI library. AIS and voyage data for position and utilization metrics. Engine and sensor telemetry — mass flow meters, shaft torque, RPM, exhaust temperature — for fuel and engine performance KPIs. CMMS or maintenance records for uptime and planned maintenance compliance. Inspection and certificate database for compliance and PSC readiness. Commercial and charter systems for TCE and voyage profitability. Emissions and compliance APIs — EU MRV verifier feeds, IMO DCS submissions, FuelEU monitoring plan data, EUA prices — for the regulatory KPIs. API integration depth with each source determines whether the dashboard delivers true real-time data or batch-refresh approximation.
How does Marine Inspection handle the four KPI categories?
Marine Inspection delivers all four categories on a single platform with a single login. Uptime KPIs (availability, MTBF, planned maintenance compliance, port time loss) feed from the integrated CMMS module. Fuel and emissions KPIs (SFOC, kg/Nm, CII rolling score, EU ETS exposure, FuelEU balance, hull performance) feed from sensor telemetry plus emissions verifier APIs. Inspection KPIs (open defects by severity, days-to-closure, certificate validity, PSC scores, schedule adherence) come from the captain mobile app and inspection database. Revenue KPIs (TCE, voyage profitability, off-hire hours, demurrage exposure, ETS pass-through) integrate from the commercial system. Workflow-trigger architecture is applied to every category — every metric has thresholds, owners, alerts, and response playbooks. Class society type-approved. Live in 10 weeks for typical mid-size fleets.