Modern fleet operators are converging on a question that did not exist as a unified metric a decade ago: what is the health of every vessel in my fleet, right now, on a single screen? The answer used to live in fragments — a vibration report from the chief engineer, an oil analysis lab result emailed from shore, a hull thickness measurement from the last drydock, a PSC inspection record in the technical superintendent's filing cabinet, and a maintenance backlog in a spreadsheet — none of them aggregating into the bird's-eye view a fleet manager actually needs to make portfolio-level decisions about deployment, charter acceptance, drydock timing, and capital allocation. A vessel health monitoring system fixes this by treating vessel health the way medicine treats patient health: a continuously updated condition score derived from real-time sensors, periodic diagnostic tests, and qualitative inspections, all rolled into a single dashboard that surfaces the vessels needing attention and confirms the vessels that are running well. The 2026 generation of these systems combines plug-and-play sensors, AI-driven digital twins, and class-society-approved condition monitoring methodology into a unified picture spanning fleets of any size. Start a free trial of Marine Inspection to see what fleet-wide vessel health monitoring looks like across tankers, OSVs, dry bulk, RoRo, and mixed fleets.
Fleet Health Monitoring · 2026
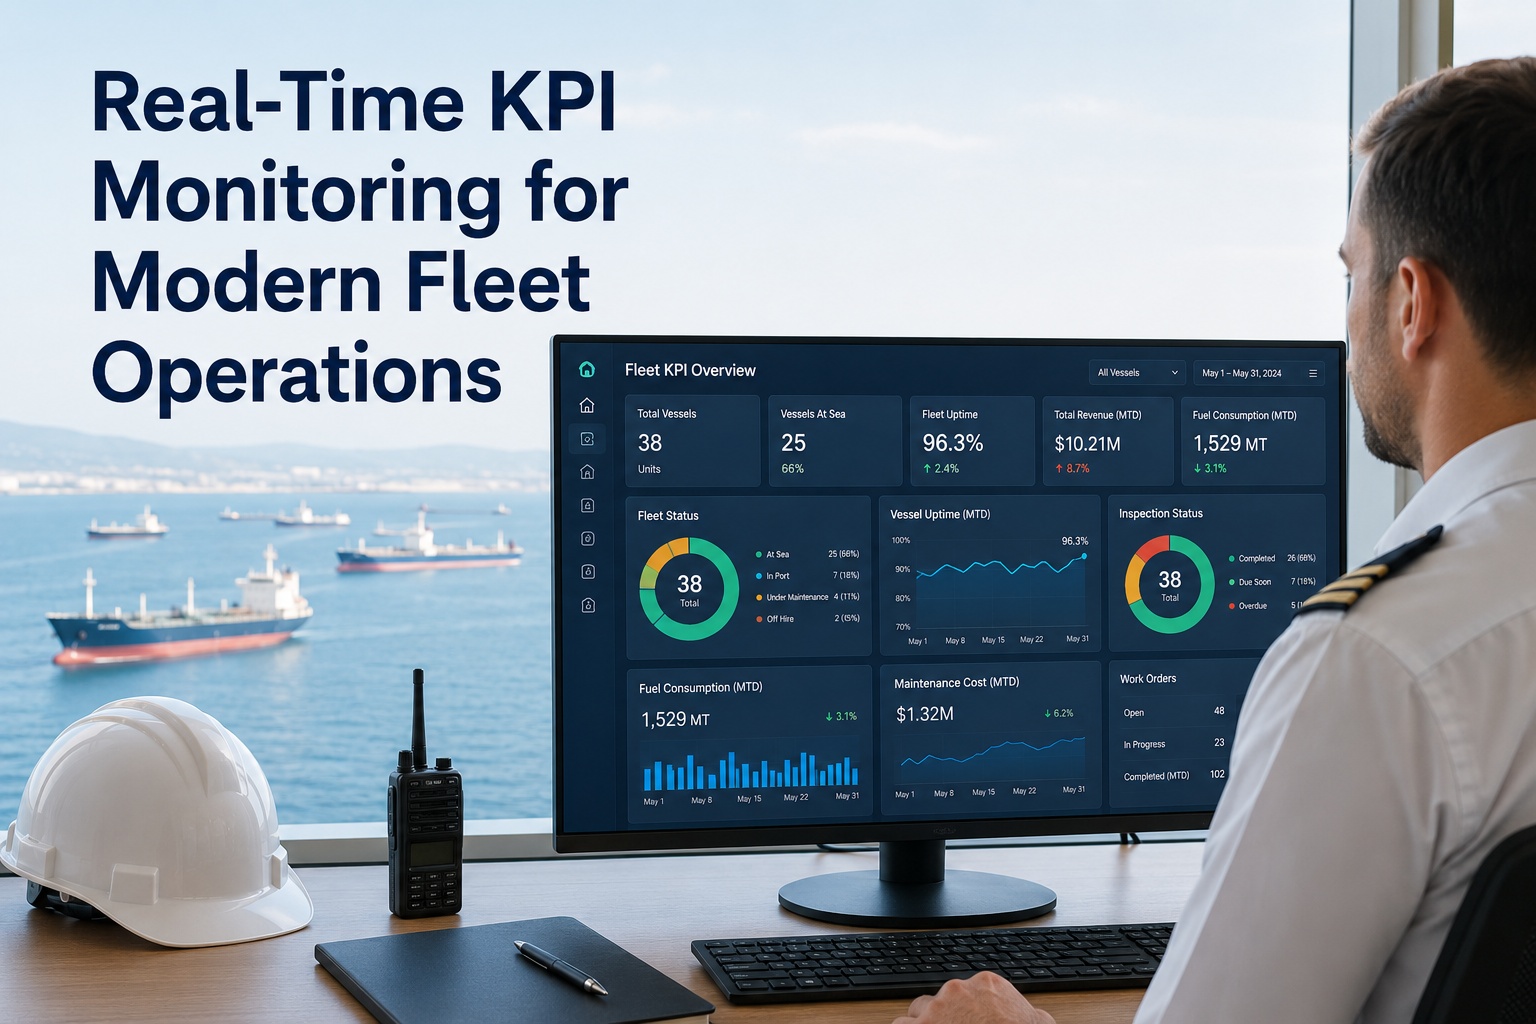
Every Vessel's Health on One Dashboard. Live Sensors. Predictive Alerts. Class-Approved Methodology.
From a fleet of 5 to a fleet of 500 — see vessel health scores, active defects, certificate validity, condition-monitoring trends, and predictive failure warnings on a single screen. Class society type-approved, ISO 17359-aligned condition monitoring framework.
Why Vessel Health Monitoring Became Mainstream in 2026
Three forces converged in 2025-2026 to push vessel health monitoring from advanced-fleet differentiator into industry baseline. First, plug-and-play sensors and low-cost edge gateways made retrofit on older vessels economically viable. Second, AI-driven digital twins matured enough to deliver useful predictive alerts rather than alarm-fatigue noise. Third, charterers and insurance providers began offering preferential terms to operators who could demonstrate sophisticated monitoring — which means the operators who do not have it are now financially penalized. The combination has made fleet-wide vessel health monitoring a competitive necessity, not an optional capability.
SENSORS
Retrofit Becomes Affordable
Low-cost edge gateways and plug-and-play sensors enable wide-scale retrofit on older vessels. The hardware barrier that kept condition monitoring locked to newbuilds and premium tonnage has collapsed. A 15-year-old bulker can run 2026-grade health monitoring with a one-week installation.
AI
Digital Twins Become Useful
AI-driven digital twins reach Level 3 (Predictive) capability — analyzing real-time sensor streams to provide one-year advance warnings on critical components like main engines and propulsion shafting. Earlier generations were diagnostic only and overwhelmed crews with false alarms.
CHARTER
Visibility Becomes a Contract Term
Major charterers are beginning to require visibility into vessel operations and compliance status. Operators without sophisticated monitoring lose access to higher-tier charter pools. The commercial cost of opacity has become measurable in lost charter premiums.
INSURANCE
Preferential Terms For Monitored Fleets
Insurance providers offer preferential premium terms to operators who demonstrate sophisticated monitoring and risk management capabilities. Hull, machinery, and P&I underwriters increasingly price the operator's monitoring maturity into renewal quotes.
What Vessel Health Actually Means — The Five Dimensions
Vessel health is not a single number. A modern monitoring system tracks five distinct dimensions, each with its own data sources, KPIs, and decision implications, and rolls them into a composite vessel health score that serves as the entry point for fleet-wide visibility. Book a Marine Inspection demo to see the five-dimension health framework configured for your fleet.
Machinery Condition
Vibration analysis, oil analysis, thermography, ultrasound testing — the four ISO 17359 condition monitoring techniques applied to main engines, generators, pumps, separators, compressors, and reduction gears. Trends signal developing failures weeks or months before alarms.
Sensors + Lab Data
Defect & Maintenance Status
Open defects by severity, days-to-closure, planned maintenance compliance, overdue critical jobs. Captures the gap between known issues and resolved issues — leading PSC detention indicator and class survey-grade evidence.
CMMS Integration
Certificate & Compliance
Statutory and class certificates with expiry windows, drill compliance, ISM/ISPS audit history, PSC and SIRE 2.0 inspection scores. Surfaces compliance exposure before it becomes a detention or charterer rejection.
Document Database
Fuel & Performance
Specific fuel oil consumption, fuel-per-nautical-mile drift, hull and propeller performance, engine thermal efficiency, CII trajectory. Fuel drift is one of the strongest leading indicators of underlying mechanical decline.
Telemetry + AIS
Hull & Structural Integrity
Hull thickness measurements, fatigue cracking indicators, corrosion wastage, mechanical denting, wave loading data. Class-approved methodologies like virtual hull condition monitoring extend vessel life and inform drydock decisions.
Sensor + Survey
The Four Condition Monitoring Techniques That Power Vessel Health Scoring
ISO 17359 — the international standard for condition monitoring — defines four primary techniques that together cover most rotating and pressurized machinery on a commercial vessel. A modern vessel health monitoring system orchestrates all four, automatically correlating findings across techniques to confirm developing faults rather than chasing single-source false alarms.
01
Vibration Analysis
The most powerful condition monitoring technique for rotating machinery. Sensors capture vibration spectra across main engines, generators, propulsion shafting, pumps, compressors, and separators. Small changes in vibration patterns reveal imbalance, misalignment, bearing wear, gear-mesh degradation, and cavitation — often weeks before audible or thermal symptoms appear.
Applies to: Main engines, generators, pumps, compressors, gearboxes
02
Oil Analysis
Lubricating oil and fuel oil samples analyzed for wear-particle composition, contamination, viscosity, total acid number, and water content. Wear-particle profiles signal which component is degrading — iron from cylinders, copper from bearings, chrome from piston rings — providing diagnostic specificity vibration alone cannot match.
Applies to: Engine lube oil, gearbox oil, hydraulic systems, fuel oil
03
Thermography
Thermal imaging captures temperature distributions across machinery, electrical panels, exhaust systems, and bearing housings. Hot-spots indicate friction, electrical resistance, insulation degradation, or restricted flow. Non-intrusive, fast to scan, and highly visual — well-suited for both routine surveys and incident investigation.
Applies to: Switchboards, exhaust manifolds, bearings, heat exchangers
04
Ultrasound Testing
Airborne and structure-borne ultrasound detects pressurized leaks (compressed air, steam, refrigerant), early-stage bearing faults, electrical arcing in switchgear, and cavitation in valves and pumps. Particularly effective for slow-speed rotating equipment where vibration analysis is less sensitive.
Applies to: Compressed air, steam systems, switchgear, slow-rotating bearings
The Three-Angle Confirmation Pattern
When vibration data, thermal imaging, and oil analysis all point to the same fault, the diagnosis becomes unarguable — and operators are willing to stop machinery for service that prevents catastrophic failure. A vessel health monitoring system that correlates findings across techniques converts isolated alarm signals into prioritized action items.
The Digital Twin Maturity Ladder — Where Your Fleet Should Be in 2026
Digital twins are classified on a 0-to-5 capability scale. Level 2 (Diagnostic) is the minimum threshold for credible vessel health monitoring; Level 3 (Predictive) is the 2026 industry target for serious operators; Level 4 (Prescriptive) is where leading fleets are actively investing. Most fleets in 2026 sit between Level 1 and Level 2 — a clear gap relative to the operators capturing the commercial benefits.
L0
Standalone
Offline modeling techniques. Static vessel data, no sensor integration. Most legacy paper or Excel-based maintenance systems sit here.
L1
Descriptive
Sensors and online modeling integrated for situational awareness. Real-time view of equipment state but no predictive logic.
L2
Diagnostic
Condition monitoring methodology applied. Anomaly detection across vibration, thermal, oil. Faults identified after they appear.
L3
Predictive
AI-driven predictive analytics. One-year advance warning on critical components. Failures forecast before symptoms emerge.
L4
Prescriptive
Decision-support embedded. System recommends specific maintenance actions, optimal timing, parts requirements, crew assignment.
L5
Autonomous
Full automation including operational decisions. Reserved for autonomous surface vessels and highly instrumented advanced platforms.
How a Modern Health Monitoring System Compares to Legacy Approaches
Most fleets in 2026 still rely on a combination of three legacy approaches: noon reports, periodic class surveys, and reactive maintenance. The structural limitations of each become visible when compared against integrated vessel health monitoring. Scroll horizontally on mobile to see the full comparison.
| Capability |
Noon Reports |
Class Surveys (Periodic) |
Reactive Maintenance |
Integrated Health Monitoring |
| Data refresh frequency |
Daily summary |
Annual / quarterly |
Event-driven only |
Real-time continuous |
| Failure prediction window |
None |
Inspection findings only |
Zero — failure has occurred |
Weeks to one year ahead |
| Vibration analysis coverage |
Not included |
Spot survey at inspection |
Diagnostic post-failure |
Continuous on critical machinery |
| Oil analysis cycle |
Not included |
Sample at survey |
After breakdown only |
Scheduled with trending |
| Thermography |
Not included |
Annual sweep maybe |
Investigation tool |
Quarterly fleet-wide |
| Hull condition tracking |
Visual deck round |
5-year drydock UTM |
Damage-driven |
Wave loading + thickness trends |
| Defect-status visibility for shore |
End-of-month report |
Survey-cycle only |
Email when broken |
Real-time fleet dashboard |
| Vessel health score |
Not calculated |
Survey grade only |
Not applicable |
Live composite score |
| Charterer / insurance evidence |
Manual compilation |
Class certificate only |
Insufficient |
One-click evidence pack |
| Drydock planning input |
Time-based estimate |
Last survey findings |
Damage condition |
Sensor + survey data combined |
| Fleet-wide comparison |
Manual pivot tables |
Independent reports |
Not applicable |
Live dashboard ranking |
| Implementation complexity |
Email plus spreadsheet |
Class society driven |
None — wait for failures |
10-12 weeks for mid fleet |
Stop Treating Vessel Health as Five Disconnected Reports
Marine Inspection delivers integrated vessel health monitoring across all five dimensions — machinery, defects, compliance, fuel performance, hull integrity — with class-approved methodology, AI-driven predictive analytics, and one composite health score per vessel. Book a demo to see your fleet's data on the dashboard.
The Six Sensor Streams Powering 2026 Vessel Health Monitoring
Plug-and-play sensors and low-cost edge gateways have transformed which data streams are economically viable for fleet-wide deployment. The six categories below cover the practical sensor envelope for commercial fleets in 2026 — comprehensive enough to deliver meaningful health scoring, affordable enough to retrofit on aging tonnage.
A
Vibration Sensors
Wireless or wired accelerometers on main engines, generators, propulsion shafting, pumps, compressors. Continuous high-frequency capture with edge processing for spectral analysis.
B
Temperature & Thermal Imaging
Fixed temperature probes on bearings, exhaust manifolds, electrical panels. Periodic thermal imaging surveys for routine and incident-driven inspection of switchgear and heat exchangers.
C
Mass Flow & Pressure
Mass flow meters on fuel oil and lube oil supply lines. Differential pressure across filters, separators, charge air coolers. Drive fuel drift detection and filter condition KPIs.
D
Oil Quality Inline
Inline oil quality sensors monitoring viscosity, water content, conductivity, and dielectric properties continuously between lab samples — providing trend visibility without requiring physical sample shipment.
E
Hull Strain & Wave
Strain gauges and wave radar capturing fatigue cycle accumulation and structural response. Class-approved methodologies like DNV's virtual hull condition monitoring use this data for life extension.
F
AIS, NMEA & PLC
Aggregating data from AIS position, NMEA bridge networks, Programmable Logic Controllers, alarm and monitoring systems into the unified vessel data lake — context for all other sensor streams.
Five Workflows That Earn The Health Monitoring Investment Back
Sensors and dashboards do not deliver value on their own. The value comes from the specific workflows the data enables. Each of the five below pays back the monitoring system investment within 12-18 months on its own contribution alone.
01
Failure Prediction With One-Year Lead Time
AI-driven analysis of vibration, thermal, and oil data flags developing failures up to one year in advance on critical components. Operators schedule overhauls in optimal windows rather than reacting to mid-Pacific breakdowns.
02
Drydock Planning From Real Data
Hull strain, thickness measurements, and machinery condition data inform drydock scope before the vessel arrives. Reduce drydock duration, eliminate scope-creep surprises, and plan parts and contractor assignments precisely.
03
Charter Acceptance Risk Scoring
Vessel health score becomes a portfolio-management metric. Fleet manager evaluates which vessels can take a 6-month charter without unacceptable breakdown risk and which need maintenance before the next deployment cycle.
04
Insurance and Charterer Evidence Pack
One-click evidence pack with monitoring data, defect closure history, and condition trends becomes the input for premium negotiations and charter acceptance. Operators with documented monitoring maturity capture the preferential terms.
05
Fleet-Wide Maintenance Prioritization
Composite vessel health scores rank the fleet by attention need. Technical superintendent capacity is allocated to the vessels that need it, instead of the loudest or the closest. Portfolio thinking replaces firefighting.
Implementation Roadmap — From Decision to Live Health Monitoring
2026 vessel health monitoring deployment is faster than most operators expect because plug-and-play sensors and pre-built integration libraries collapse the technical preparation phase. Most mid-size fleets reach productive use within 10-12 weeks of decision, with phased rollout across the fleet rather than big-bang go-live.
Wk 1-2
Fleet Asset Audit
Vessel inventory imported. Critical machinery identified per vessel. Existing condition monitoring data (prior vibration reports, oil analyses) loaded as baseline. Health score weighting agreed across the five dimensions.
Wk 3-5
Sensor Deployment Pilot
Pilot vessel sensor installation. Plug-and-play vibration sensors, temperature probes, oil quality sensors, edge gateway. NMEA, AIS, PLC integration. Initial data flowing within days of installation.
Wk 6-8
Health Scoring & Alert Configuration
Composite health score calibrated against pilot vessel actual performance. Alert thresholds tuned per equipment class. Predictive model training on accumulated data. False-positive rate driven down before fleet rollout.
Wk 9-12
Fleet Rollout & Routine
Phased sensor installation across remaining fleet (typically during scheduled port calls). Shore-side training. Daily fleet health review cadence established. First commercial benefits visible within month one.
The ROI Math For Vessel Health Monitoring
Operators deploying integrated vessel health monitoring report measurable returns across multiple compounding dimensions. The numbers below are conservative and consistent across published case studies and operator surveys from 2024-2026. Payback for mid-size fleets typically runs 12-18 months on the integrated platform investment.
1 yr
Advance Failure Warning
Achievable on critical components like main engines and propulsion systems through AI-driven condition monitoring with three-angle confirmation.
30%
Unplanned Downtime Reduction
Operators report after deploying integrated health monitoring with predictive analytics and automated workflow triggers.
15-25%
Maintenance Cost Reduction
Through condition-based maintenance replacing calendar-based intervals — preventing unnecessary work while catching real degradation.
8-15%
Insurance Premium Improvement
Indicative range for hull, machinery, and P&I terms when operators demonstrate sophisticated monitoring maturity to underwriters.
12-18 mo
Typical Payback
For mid-size fleets adopting integrated vessel health monitoring with sensor retrofit and dashboard deployment in 10-12 weeks.
Why Marine Inspection For Vessel Health Monitoring
Marine Inspection delivers integrated vessel health monitoring built on class-approved methodology, ISO 17359-aligned condition monitoring framework, and 2026-grade plug-and-play sensor architecture. Every dimension — machinery condition, defect status, certificate compliance, fuel performance, hull integrity — feeds the same composite vessel health score with audit-ready evidence trails. Sign up for a free trial or book a live demo to see your fleet's vessels on a unified health dashboard within weeks.
01
Five-Dimension Health Framework
Machinery, defects, compliance, fuel performance, hull integrity. Composite health score per vessel and rolled-up fleet health rank. Single dashboard, single source of truth, single conversation across technical, operations, commercial, and DPA teams.
02
ISO 17359 Condition Monitoring Aligned
Vibration, oil, thermography, ultrasound — the four ISO 17359 techniques orchestrated together. Three-angle confirmation pattern reduces false alarms and turns condition data into prioritized action items.
03
AI-Driven Digital Twin (Level 3 Predictive)
Predictive analytics delivering one-year advance warning on critical components. Reaches industry 2026 target Level 3 capability rather than the legacy descriptive-only approach most fleets still operate.
04
Plug-and-Play Sensor Architecture
Low-cost edge gateways and wireless sensors enable retrofit on aging tonnage. Installation typically during scheduled port calls. No drydock visit required for sensor commissioning.
05
Class Society Type Approved
Multi-class type approval. Suitable as part of class-approved Planned Maintenance Survey systems and Continuous Survey of Machinery (CSM) programs. Audit-ready evidence chain for class society and PSC inspection.
06
Insurance and Charterer Evidence Pack
One-click evidence pack with monitoring data, defect closure history, and condition trends. Direct input to insurance renewals and charterer acceptance — the commercial side of monitoring maturity.
Run 2026 With Every Vessel's Health on One Screen
Five-dimension health framework, ISO 17359 condition monitoring, Level 3 predictive digital twin, plug-and-play sensors, class society type approval, insurance and charterer evidence pack — all in one platform built for fleet managers running 2026 operations. Book a demo to see your fleet on the dashboard.
Frequently Asked Questions
What is a vessel health score and how is it calculated?
A vessel health score is a composite metric representing the overall condition and operational fitness of a single vessel, typically presented on a 0-100 scale where higher is better. It combines weighted inputs from five dimensions: machinery condition (vibration, oil, thermal, ultrasound data), defect and maintenance status (open defects by severity, planned maintenance compliance), certificate and compliance state (statutory and class certificates, drill compliance, inspection scores), fuel and performance metrics (consumption drift, hull and propeller condition, CII trajectory), and hull and structural integrity (thickness measurements, fatigue indicators). The weighting can be tuned to operator priorities — a tanker operator might weight compliance higher; an OSV operator might weight machinery condition higher.
What is ISO 17359 and why does it matter?
ISO 17359 is the international standard providing guidelines for implementing condition monitoring programs and selecting appropriate techniques for machinery maintenance. It defines the four primary condition monitoring techniques (vibration analysis, oil analysis, thermography, ultrasound testing) and the methodology for applying them. Modern vessel health monitoring systems align with ISO 17359 because the framework is what class societies, insurance underwriters, and major charterers recognize as credible monitoring practice — meaning ISO 17359 alignment translates into commercial acceptance.
What is the digital twin maturity scale?
Digital twins are classified on a 0-to-5 capability scale. Level 0 (Standalone) uses offline modeling with no sensor integration. Level 1 (Descriptive) integrates sensors and online modeling for situational awareness. Level 2 (Diagnostic) focuses on condition monitoring and anomaly detection — faults are identified after they appear. Level 3 (Predictive) incorporates predictive analytics, forecasting failures before symptoms emerge. Level 4 (Prescriptive) embeds decision-support systems recommending specific actions. Level 5 (Autonomous) enables advanced functionality like collision avoidance for autonomous vessels. Industry 2026 target for serious operators is Level 3; most fleets currently sit between Level 1 and Level 2.
Can older vessels participate or only newbuilds?
Older vessels participate fully. The 2026 generation of plug-and-play sensors and low-cost edge gateways was designed specifically to enable wide-scale retrofit on aging tonnage. A 15-year-old bulker can run modern vessel health monitoring with installation during a single port call. Wireless vibration sensors, magnetic-mount temperature probes, inline oil quality sensors, and edge gateways requiring only power and ethernet are the typical retrofit kit. Class society type approval covers retrofitted installations as long as installation methodology and data integrity meet requirements.
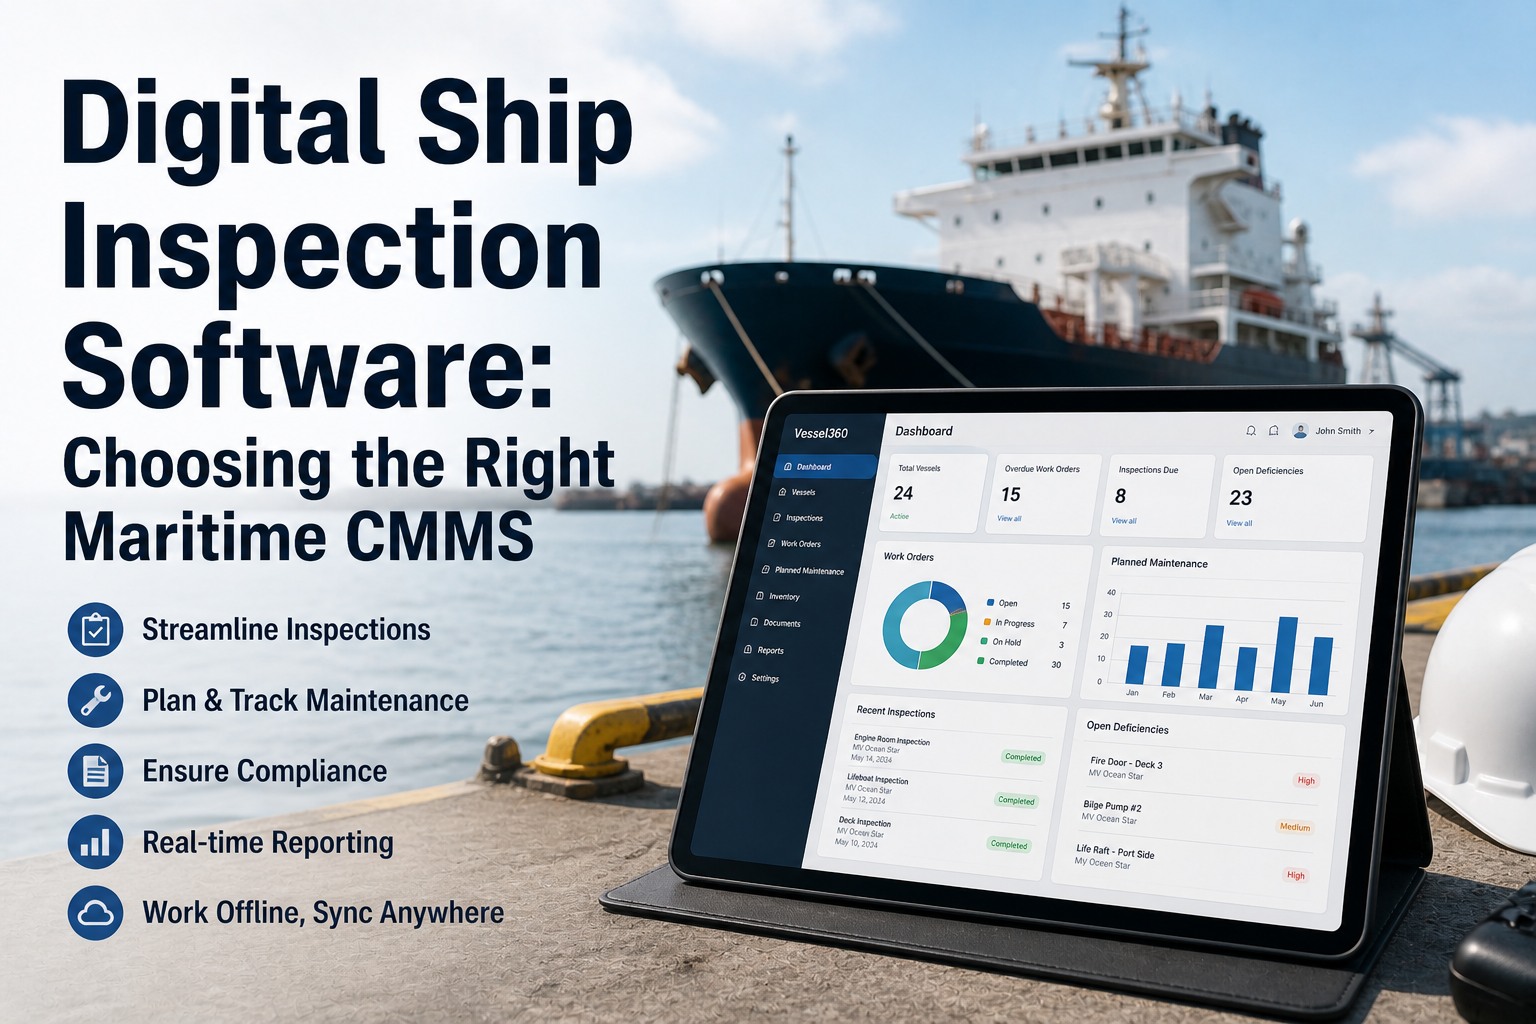
How does this differ from a CMMS?
A CMMS (Computerized Maintenance Management System) handles work orders, planned maintenance, spare parts inventory, and maintenance records. A vessel health monitoring system sits above the CMMS, ingesting CMMS data along with sensor data, certificate database, fuel telemetry, and hull condition records to produce composite health scoring and predictive alerts. The CMMS is the operational system of record for maintenance execution; the health monitoring system is the analytical and decision-support layer for fleet managers, technical superintendents, and commercial teams. Best-practice 2026 architectures integrate both rather than replacing one with the other.
What ROI is realistic for fleet operators?
Conservative benchmarks consistent across operator case studies: up to one year advance failure warning on critical components, 30% reduction in unplanned downtime, 15-25% maintenance cost reduction through condition-based intervention replacing calendar-based, and 8-15% insurance premium improvement when monitoring maturity is documented to underwriters. Charterer-side benefits — access to higher-tier charter pools and stronger acceptance terms — are harder to quantify in a single number but increasingly visible in 2026 contracts. Typical payback for mid-size fleets (10-30 vessels) is 12-18 months on integrated platform investment with sensor retrofit and dashboard deployment.
How long does deployment typically take?
10-12 weeks for typical mid-size fleets. Weeks 1-2 cover fleet asset audit and existing data import. Weeks 3-5 are pilot vessel sensor installation and integration. Weeks 6-8 involve health scoring calibration and alert configuration with predictive model training. Weeks 9-12 are phased fleet rollout, typically scheduled during port calls to avoid drydock dependency. Pilot vessel typically generating live health data by week 5; full fleet on the dashboard by week 12. The compressed timeline depends on plug-and-play sensor architecture and pre-built integration libraries — generic IoT platforms or build-from-scratch approaches typically take 6-12 months.
How does Marine Inspection deliver vessel health monitoring?
Five-dimension health framework: machinery condition, defects, compliance, fuel performance, hull integrity — composite vessel health score per vessel and rolled-up fleet ranking. ISO 17359-aligned condition monitoring orchestrating vibration, oil, thermography, and ultrasound with three-angle confirmation. Level 3 (Predictive) digital twin capability with AI-driven one-year advance warning on critical components. Plug-and-play sensor architecture for retrofit on aging tonnage. Multi-class type approval supporting Continuous Survey of Machinery programs. Insurance and charterer evidence packs generated on one click. 10-12 week deployment for typical mid-size fleets. Mobile-first responsive design for fleet managers monitoring from phones during yard walks and travel. Book a live demo or start a free trial to evaluate against your fleet operation.