Two sister vessels on the same route, carrying the same cargo, can burn markedly different amounts of fuel — and without analytics, nobody knows why, or which one is the problem. That gap is where the savings hide. A marine fuel analytics dashboard turns the flood of operational data — consumption, speed, draft, trim, weather, hull condition, voyage and route — into a clear picture of how every vessel actually performs, benchmarked against its own baseline and against the rest of the fleet. The insight is rarely one big number; it is a steady stream of smaller ones: a speed policy that costs more than it saves, a hull quietly fouling and dragging consumption up, a trim setting that is not optimal, a route that fought the weather. Each is a few percent, and a few percent on a fleet's largest controllable cost compounds into real money every quarter. This guide explains what a fuel analytics dashboard visualizes, the normalized KPIs that make vessels comparable, how it separates a fouling hull from a heavy-footed speed policy, and why turning fuel data into insight is the difference between paying for inefficiency and eliminating it. To see fuel analytics on a live fleet, book a Marine Inspection demo.
Turn fuel data into savings
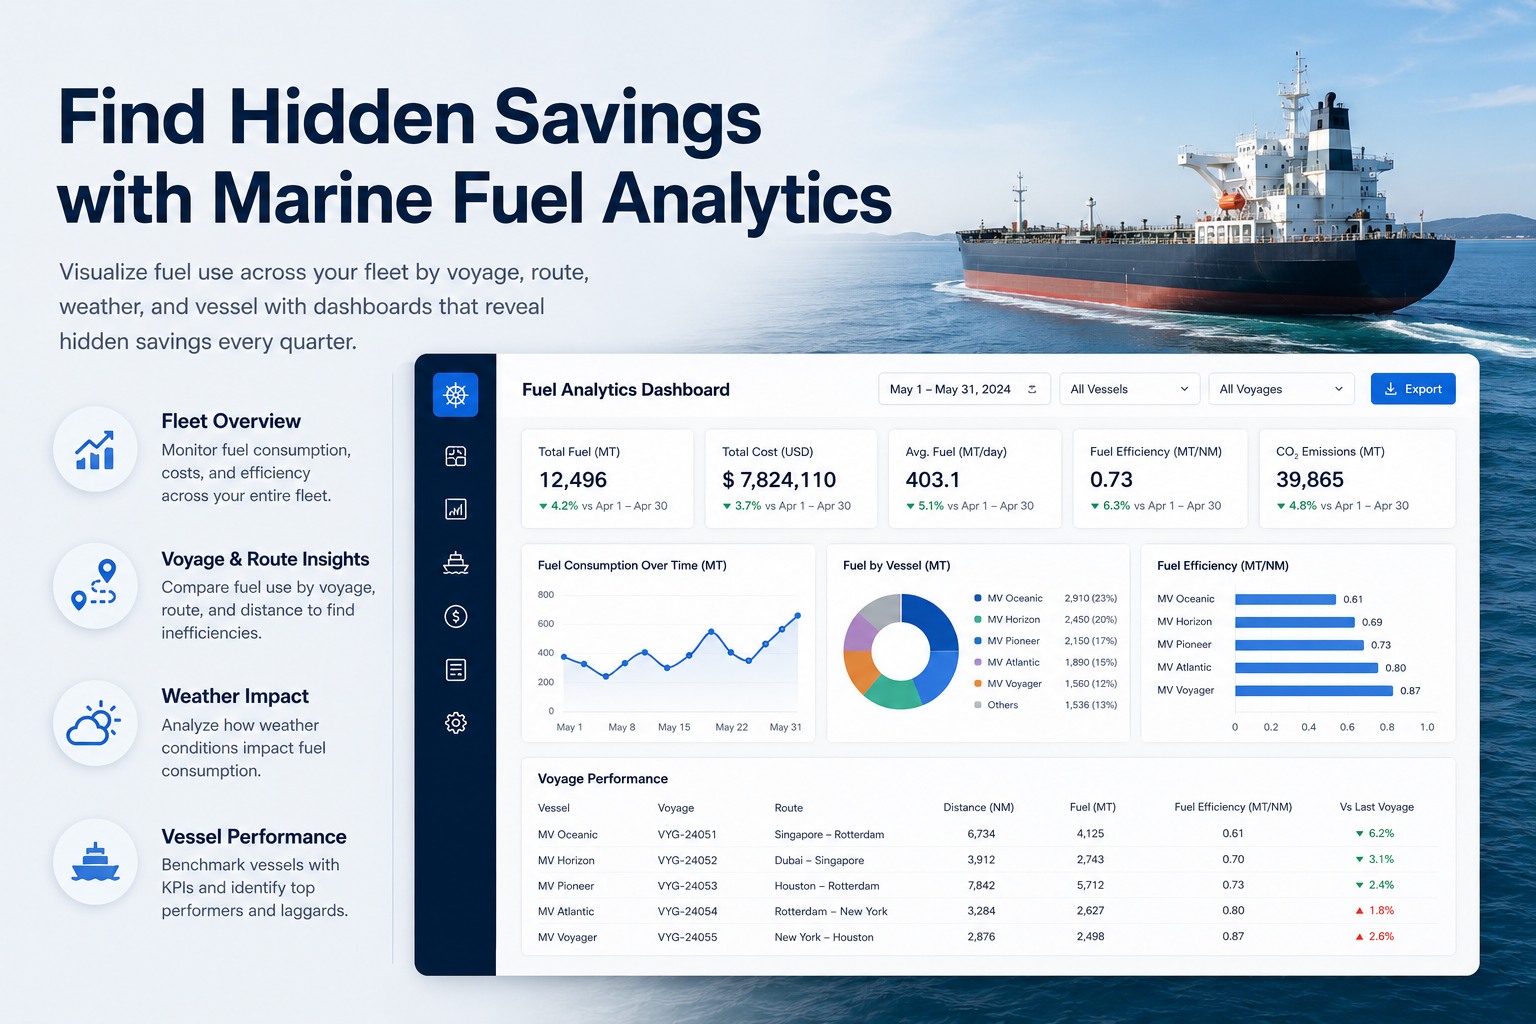
Find the Hidden Savings in Your Fuel Data
Visualize consumption by voyage, route, weather, and vessel, benchmark every ship against its baseline and its sisters, and surface the inefficiencies that quietly cost a few percent every quarter.
per nmnormalized fuel KPI for true comparison
baselinemeasured vs expected performance envelope
fleet-widesister-vessel benchmarking in one view
Book a Demo
What a Fuel Analytics Dashboard Visualizes
A vessel under operation generates an enormous range of parameters, and fuel consumption is shaped by almost all of them. The dashboard's job is to bring these together so consumption can be understood in context rather than as a raw monthly figure. See the dashboard in a demo.
By voyage
Consumption per voyage including idle time and port calls, so each leg can be compared and the costly ones investigated.
By route
Fuel use mapped to the route sailed, exposing where distance, congestion, or routing choices drive cost up.
By weather
Consumption set against wind, wave, and current, separating weather-driven burn from genuine inefficiency.
By vessel
Each ship's performance against its own history and its sisters, so outliers and top performers are obvious.
By speed & trim
The effect of speed policy and trim on consumption, quantifying operational trade-offs with measured data.
By hull condition
Long-term efficiency trends that reveal hull fouling and propeller degradation as they slowly raise consumption.
The Normalized KPIs That Make Vessels Comparable
Raw consumption figures cannot be compared — a fast leg in heavy weather burns more than a slow one in calm seas, and that tells you nothing about efficiency. Analytics solves this with normalized KPIs that strip out the variables, so a real performance difference stands out from noise.
Core Fuel Performance KPIs
These baselines are derived from sea-trial results or early operational data under known clean conditions — the expected performance envelope. By comparing actual performance against that envelope over time, the dashboard quantifies degradation and measures whether a corrective action actually worked, rather than relying on impression.
See it on your fleet
See Which Vessels Are Quietly Costing You
Marine Inspection visualizes fuel consumption by voyage, route, weather, and vessel, benchmarks each ship against its baseline and its sisters with normalized KPIs, and flags the efficiency losses that compound every quarter. Book a 30-minute demo to see fuel analytics on a fleet like yours, or start a free trial and connect your data today.
Separating Technical Degradation From Operational Inefficiency
The most valuable thing analytics does is answer a question crews argue about constantly: is the extra fuel the ship's fault or the way it is being run? Normalized benchmarking distinguishes the two, so the fix is targeted rather than guessed. See the breakdown in a demo.
Technical degradation
Hull fouling raising resistance over months
Propeller roughness reducing thrust efficiency
Engine wear shifting the speed-power curve
Operational inefficiency
Speed policy burning more than it saves
Suboptimal trim increasing resistance
Routing that fought avoidable weather
This distinction also reshapes maintenance. Instead of cleaning a hull on a fixed calendar, the dashboard triggers it on measured performance loss — so the work happens when the data shows it will pay for itself, not before and not too late. That is condition-based maintenance driven by fuel analytics.
From Insight to Quarterly Savings
The point of analytics is action, and the savings accumulate across several levers that only become visible once the data is normalized and benchmarked. None is dramatic alone; together they move the fleet's largest cost.
Speed optimization
Quantify the real fuel cost of speed against schedule, so speed policy is set on data rather than habit.
Trim optimization
Identify the trim that minimizes resistance for the load and speed, validated with measured consumption.
Hull-cleaning timing
Trigger cleaning and propeller polishing on measured efficiency loss, capturing the gain without over-servicing.
Retrofit evaluation
Measure the before-and-after of coatings or upgrades on one vessel before rolling them out fleet-wide.
Charter decisions
Compare vessels on empirical performance, so the most efficient ship is chosen for the voyage.
Crew awareness
Give crews clear, instant performance data, fostering a culture of efficiency that holds the gains.
How Marine Software Runs Analytics — and Why It's Needed
Fuel analytics only works if the data is captured consistently, normalized correctly, and presented for decisions rather than buried in a spreadsheet. Purpose-built marine software does all three, where manual log analysis cannot.
Standardized data capture
Consumption, speed, draft, trim, weather, and navigation data are captured consistently, so the analysis rests on reliable inputs.
Normalized benchmarking
KPIs like fuel per nautical mile and speed-power ratio let vessels and voyages be compared on a like basis, not raw totals.
Baseline comparison
Actual performance is set against the clean-condition envelope, quantifying degradation and proving whether fixes worked.
Decision-ready dashboards
Trends and deviations are visualized for action, so a fouling hull or a costly speed policy is obvious at a glance.
Linked to maintenance
Performance loss triggers condition-based maintenance, so hull cleaning and overhauls happen when the data justifies them.
Compliance built in
Emissions intensity feeds CII, SEEMP, and FuelEU reporting, turning the same data into both savings and compliance.
The deeper reason it is needed is that fuel efficiency is a multi-variable problem no human can untangle from a logbook. Consumption depends on speed, draft, trim, weather, hull condition, and routing all at once, and only normalized analytics can hold those variables steady to reveal the true signal. That signal — which vessel, which voyage, which decision is costing more than it should — is where the quarterly savings live. Book a demo to see it on your fleet.
Frequently Asked Questions
What is a marine fuel analytics dashboard?
It is a tool that visualizes a fleet's fuel consumption across voyage, route, weather, speed, trim, and vessel, benchmarking each ship against its own baseline and its sisters using normalized KPIs. It turns raw consumption data into actionable insight, revealing the inefficiencies — fouling, speed policy, trim, routing — that quietly raise fuel cost.
What KPIs matter most for fuel performance?
The core normalized KPIs are fuel per nautical mile, speed-power ratio, and propulsion efficiency, plus consumption against a clean-condition baseline and emissions intensity for CII and FuelEU. These strip out variables like weather and speed so a real efficiency difference between vessels or voyages stands out from noise.
How does analytics tell degradation from inefficiency?
By benchmarking normalized performance against a baseline. A gradual rise in fuel per nautical mile at constant conditions points to technical degradation like hull fouling or propeller roughness, while consumption that spikes with speed or trim choices points to operational inefficiency. The distinction makes the corrective action targeted rather than guessed.
How does it help with maintenance?
By tracking long-term efficiency trends, the dashboard triggers maintenance such as hull cleaning or propeller polishing on measured performance loss rather than a fixed calendar. This condition-based approach captures the efficiency gain when it will pay for itself, avoiding both over-servicing and the slow drain of running a fouled hull too long.
Can it support emissions compliance?
Yes. The same consumption data that drives savings also produces emissions intensity, feeding CII ratings, the SEEMP, and FuelEU Maritime reporting. Analytics also lets operators evaluate efficiency projects and retrofits with verifiable data, so compliance planning and cost savings come from one source rather than two separate efforts.
How much can fuel analytics actually save?
Savings come from several levers — speed and trim optimization, well-timed hull cleaning, better routing, and efficient charter choices — each typically a few percent. On a fleet's largest controllable cost, those percentages compound into substantial savings every quarter, which is why analytics focuses on surfacing the steady stream of small gains rather than one dramatic fix.
Built for marine fuel performance
Stop Paying for Inefficiency You Cannot See
Consumption visualized by voyage, route, weather, and vessel; normalized KPIs and baseline benchmarking; degradation separated from inefficiency; and condition-based maintenance triggers — all in one platform alongside your maintenance and fuel records. Marine Inspection turns fuel data into quarterly savings. Book a tailored walkthrough or start a free trial today.