The single biggest reason fleet operators fail to extract value from their software in 2026 is not data scarcity — it is data overload. A typical maritime operations team can pull from AIS feeds tracking 661,000+ vessels and 1.3 billion AIS signals daily, plus engine telemetry, fuel sensors, ballast water records, certificate databases, charterer reporting portals, EU MRV submissions and IMO DCS data. Without a properly architected dashboard, all of that becomes noise. Industry research is unambiguous: showing 30+ KPIs with equal visual weight creates "dashboard fatigue" where managers stop opening the reports entirely. The fleet management dashboards that actually drive decisions follow a different design philosophy — a tiered KPI hierarchy where 4 "north star" metrics dominate the glance view, role-based views for fleet managers vs superintendents vs masters, traffic-light status indicators, and mobile-first responsive layouts so decisions can be made during a yard walk or in a port without returning to the desk. This guide breaks down the dashboard architecture that works in 2026 — the four KPI pillars, 25+ marine-specific metrics every fleet should track, the role-based view patterns, the integration sources, and the ROI math. Book a Marine Inspection demo to see what a properly architected fleet dashboard looks like running on real fleet data.
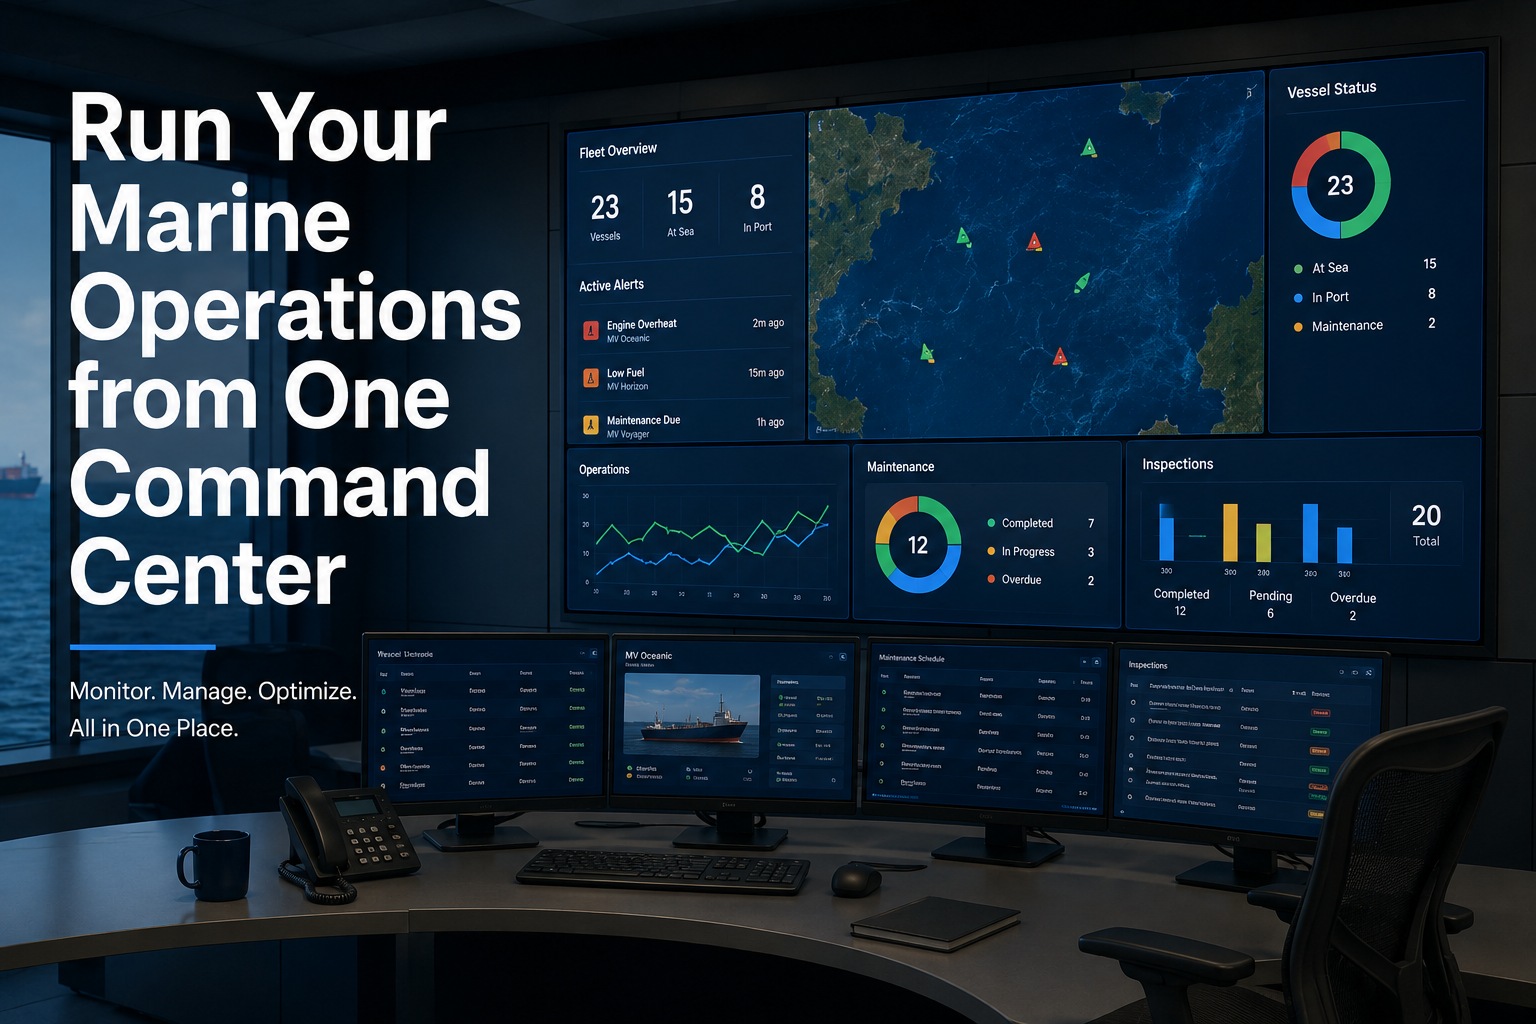
FLEET COMMAND CENTER
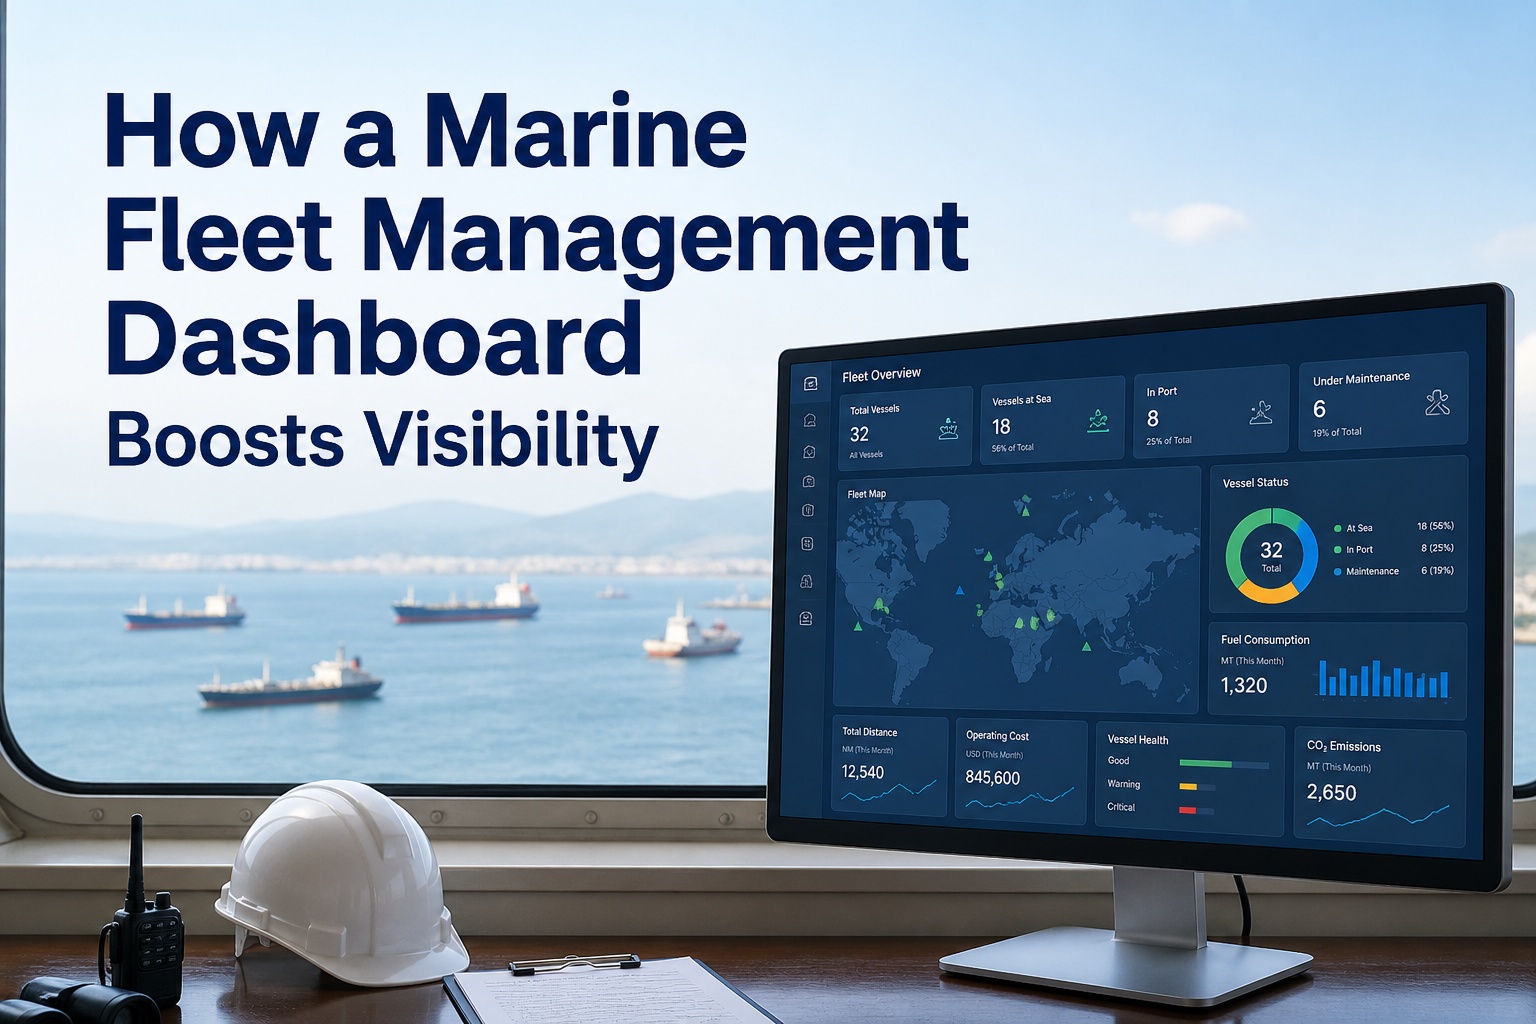
From "Where Is My Fleet?" to "Which Three Vessels Need Me Now?" In 10 Seconds.
A modern marine fleet management dashboard does not just show data — it surfaces the right data, in the right hierarchy, in real-time, so a fleet manager can go from log-in to action in under ten seconds.
10sFrom login to action
4North-star KPIs
25+Marine metrics tracked
30 hrs/vessel/yr saved on reporting
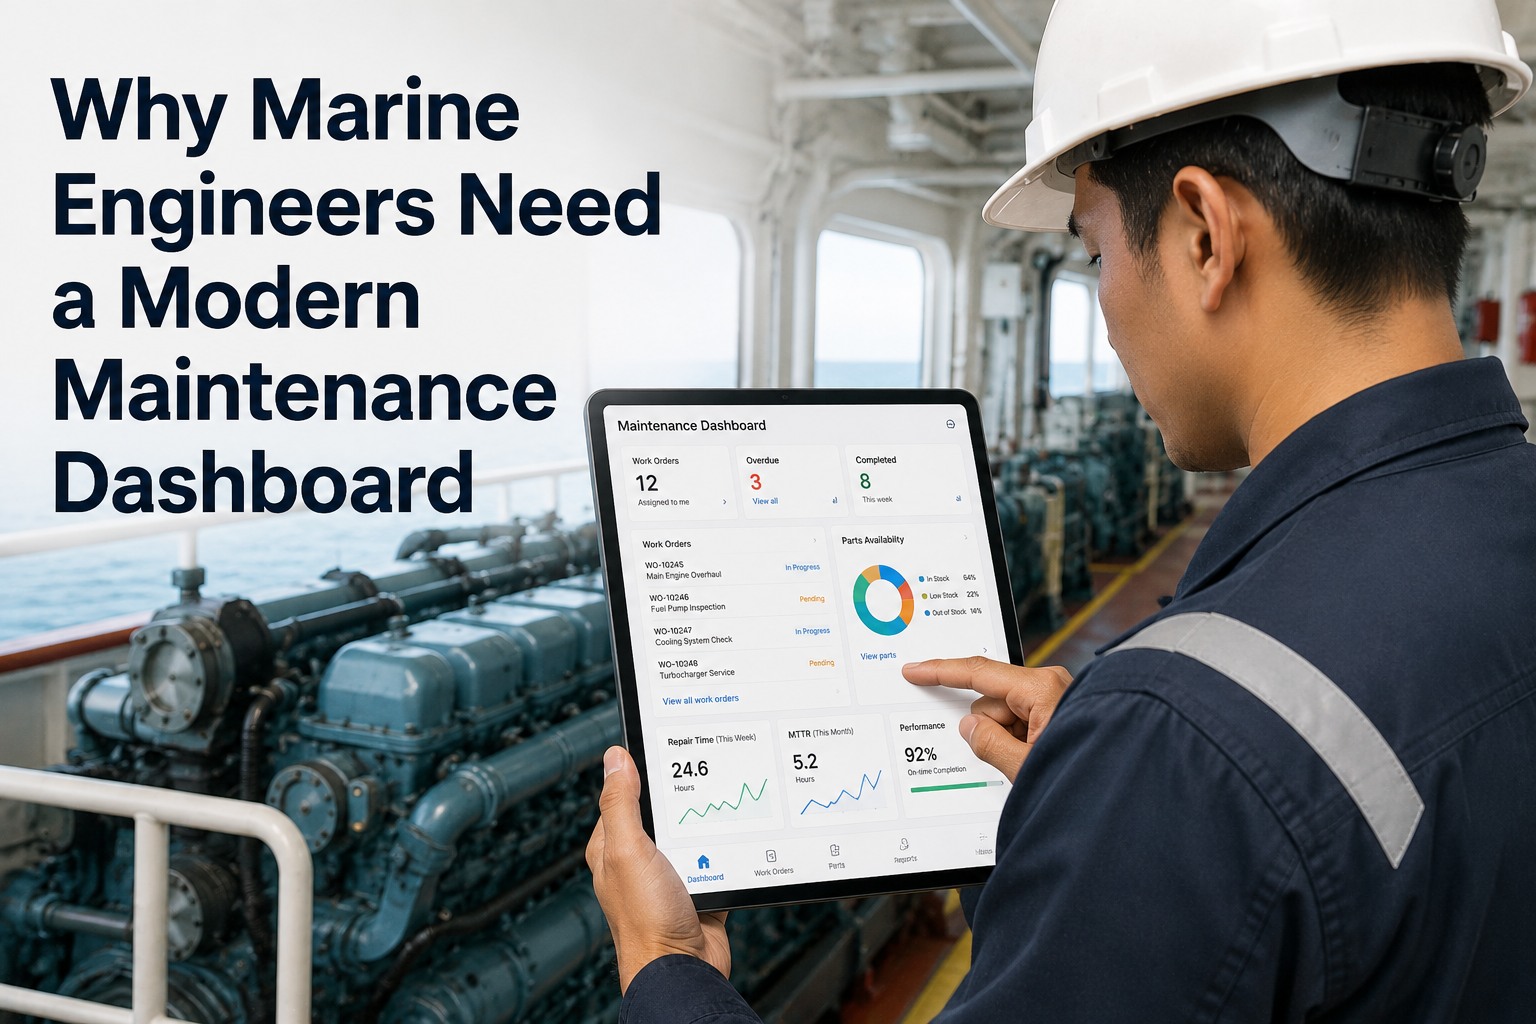
The Dashboard Fatigue Problem That Sinks Most Fleet Software
Walk into the operations office of a typical mid-size maritime fleet in 2026 and you will see the same scene: monitors filled with 40-cell dashboards, every cell weighted equally, traffic-light icons everywhere, and a fleet manager who has stopped looking at the screen because everything is yellow. This is dashboard fatigue. The cause is not too much data; it is undifferentiated data. When 40 metrics fight for the same visual space, none of them communicates. The cure is architecture — a tiered hierarchy where the eye lands on the 3-4 metrics that matter and one click takes the operator to the diagnostic detail. Sign up for Marine Inspection to put your fleet on a dashboard built around hierarchy rather than density.
X
Legacy Dashboard Pattern
40+ metrics shown with equal visual weight
Numerical tables with no trend indicators
Static reporting — refresh on Monday morning
One screen for all roles, no personalization
Desktop-only, manager returns to office
Drill-down requires Excel export
Visible answer: "Everything looks yellow"
Outcome: Manager stops opening the dashboard
Y
2026 Dashboard Pattern
3-4 north-star KPIs at glance, large visual weight
Trend indicators (green up / red down) on every metric
Real-time data, AIS + telemetry feeds
Role-based views: fleet manager / DPA / chief engineer
Mobile-first responsive — decisions made on phone
One-click drill-down from any KPI
Visible answer: "These three vessels need me today"
Outcome: Manager logs in 5x daily, decisions accelerate
The Four-Pillar KPI Architecture That Actually Works
Every metric on a well-architected fleet dashboard maps to one of four strategic pillars. A balanced dashboard pulls from all four — not 80% cost metrics with nothing on safety. The pillar approach prevents over-indexing on whichever number is easiest to measure and forces a balanced operational view.
Cost
Where the budget is bleeding
Whether vessels are earning their balance-sheet weight or consuming margin. The pillar that drives most CFO-level conversations.
Operating cost per nautical mile
Total cost of ownership per vessel
Maintenance spend per vessel per quarter
Fuel cost trend (vs benchmark)
Bunkering price tracking
Off-hire days as % of charter
Utilization
Whether assets are working hard enough
Idle vessels are capital tied up earning nothing. Utilization metrics expose underused fleet capacity and route patterns.
Vessel utilization rate (% of operational days)
Unplanned downtime percentage
Idle time at anchor / port days
Voyage turnaround speed
Cargo capacity utilization
Sailed vs standby vs weather-hold breakdown
Safety
Protecting people and reputation
Safety KPIs protect crew, P&I premiums, and the operator's standing with charterers and class societies. Lagging here = commercial penalties.
PSC inspection deficiency rate
PSC detention frequency
Lost time injury frequency rate
Near-miss reporting volume
Drill compliance per vessel
Crew rest-hour compliance
Compliance
Staying ahead of regulator exposure
Class societies, port state control, charterers and EU MRV reporting all demand evidence. Dashboards make compliance visible BEFORE deadlines pass.
Certificate expiry alerts (30/60/90 day)
Planned maintenance compliance %
ISM internal audit findings
Charterer audit pass rate
EU MRV / IMO DCS reporting status
Carbon Intensity Indicator (CII) rating
See Your Four Pillars Live On Your Own Fleet Data
Cost, Utilization, Safety, Compliance — all four pillars on a single command-center dashboard, role-personalized for fleet manager, superintendent, DPA, and chief engineer. See it running on Marine Inspection with sample fleet data, then decide.
The Comprehensive Marine Fleet Dashboard KPI Reference Table
Below is the comprehensive reference of metrics that should be available across the four pillars on a modern marine fleet dashboard. Use this table to evaluate whether your existing dashboard supports the metrics your operation needs — or to specify your requirements before vendor selection. Scroll horizontally on mobile to see the full pillar / metric / target / drill-down columns.
| Pillar |
KPI / Metric |
Why It Matters |
Target / Benchmark |
Drill-Down View |
Update Frequency |
| COST | Operating cost per nautical mile | Headline financial efficiency metric | Trend declining vs prior year | Per-vessel cost breakdown | Daily |
| COST | Maintenance spend per vessel | Identifies high-cost outliers in fleet | Within 10% of fleet average | Work-order level history | Daily |
| COST | Fuel cost / consumption trend | Largest variable operating cost | Below voyage benchmark | Per-leg fuel data | Per voyage |
| COST | Off-hire days percentage | Direct hit to chartered revenue | Less than 2% target | Off-hire reasons by vessel | Daily |
| COST | Spare parts inventory turnover | Working capital efficiency | Within fleet-defined band | Slow-moving stock list | Weekly |
| UTIL | Vessel utilization rate | How hard the asset is working | 85%+ for commercial fleet | Status by day per vessel | Real-time |
| UTIL | Unplanned downtime % | Maintenance failure indicator | Less than 3% target | Downtime events by category | Real-time |
| UTIL | Port turnaround time | Operational efficiency measure | Below port benchmark | Per-call timeline | Per call |
| UTIL | On-time arrival rate | Charterer / customer commitment | 95%+ industry benchmark | Per-voyage variance | Per voyage |
| UTIL | Cargo capacity utilization | Revenue per voyage maximization | 90%+ on routes with demand | Per-voyage stowage | Per voyage |
| UTIL | Sailed vs standby vs weather | Asset deployment effectiveness | Maximize sailed; minimize weather | Status timeline per vessel | Real-time |
| SAFETY | PSC deficiency rate | Direct port state inspection exposure | Trend declining; below regional avg | Deficiencies per inspection | Per inspection |
| SAFETY | PSC detention frequency | Hard commercial outcome of failures | Zero ideally | Detention root cause | Per detention |
| SAFETY | Lost time injury frequency rate | Crew safety performance | Industry-leading benchmark | LTI category & trend | Monthly |
| SAFETY | Near-miss reporting volume | Healthy reporting culture indicator | Increasing reporting = good | Near-miss themes | Weekly |
| SAFETY | Drill completion compliance | SOLAS / SMS / charter required | 100% per fleet schedule | Drill log per vessel | Weekly |
| SAFETY | Crew rest-hour compliance | MLC requirement; fatigue prevention | 100% with no exceptions | Per crew per week | Weekly |
| COMP | Certificate expiry alerts | Detention prevention top driver | Zero certificates expired | Certificate by category | Daily |
| COMP | Planned maintenance compliance | Class society PMS requirement | 95%+ jobs on schedule | Overdue jobs by vessel | Daily |
| COMP | ISM audit findings | Internal SMS health | Trend declining year-over-year | Open findings list | Per audit |
| COMP | Charterer audit pass rate | Commercial eligibility | 100% for major OEM/charter contracts | Audit-by-audit detail | Per audit |
| COMP | EU MRV / IMO DCS reporting | Mandatory emissions reporting | 100% on time | Per-vessel report status | Per voyage |
| COMP | CII rating per vessel | IMO carbon intensity grade | Grade C or better | CII trend trajectory | Annual |
| COMP | Class survey schedule status | 5-year cycle deadline tracking | All surveys current | Per-vessel survey calendar | Daily |
| COMP | Sulphur cap compliance | MARPOL Annex VI requirement | 0.5% global / 0.1% ECA | Bunker delivery notes | Per bunker |
Role-Based Dashboard Views — Fleet Manager vs Superintendent vs Master
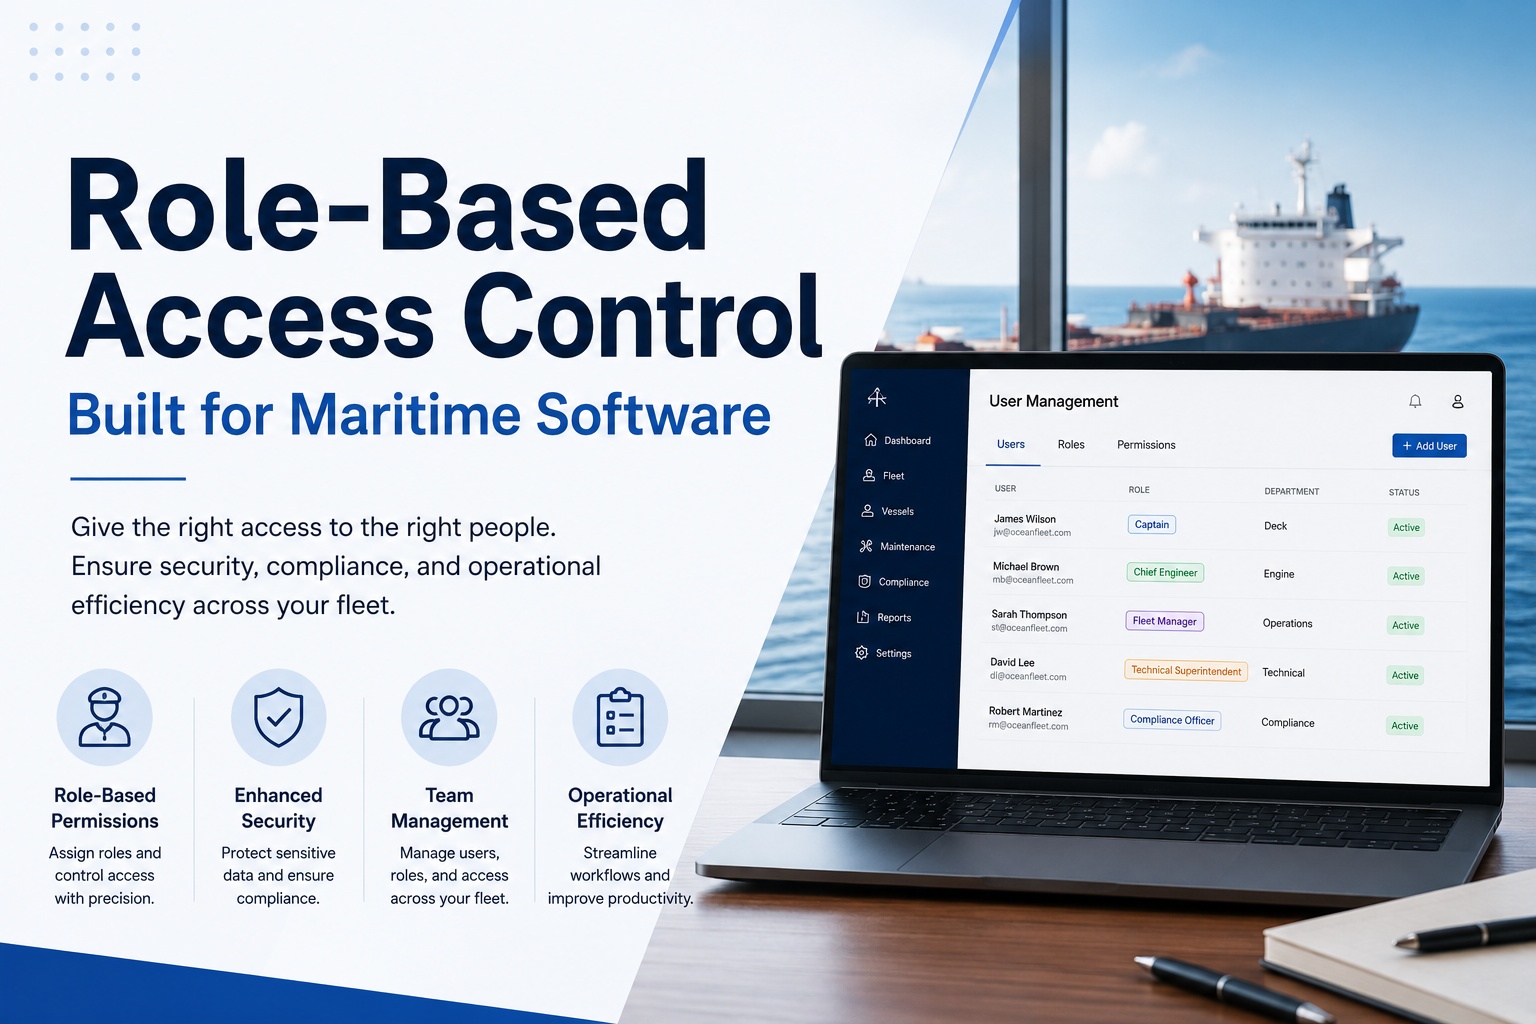
One of the biggest UI failures in legacy fleet software is forcing every role onto the same cluttered view. A fleet manager needs high-level financial and compliance KPIs. A superintendent needs vessel-level technical condition. A DPA needs SMS audit and regulatory exposure. A chief engineer needs maintenance backlog and engine performance. A master needs operational status and certificate validity. Modern marine fleet dashboards apply role-based personalization so each user sees the metrics relevant to their job first — with optional drill-through to broader views.
North-star financial and compliance view. Cost per mile, fleet utilization, off-hire trend, certificate expiry alerts, charterer audit calendar.
Primary screen: Fleet-wide cost & compliance KPIs
Vessel-level technical condition view. Maintenance backlog, dry-docking schedule, equipment alerts, spare parts status, vessel-by-vessel deficiency tracker.
Primary screen: Vessel technical health matrix
Safety and compliance focus. ISM audit findings, near-miss reporting, drill completion, PSC inspection history, certificate database.
Primary screen: SMS health & regulatory exposure
Onboard maintenance focus. Today's planned jobs, overdue work orders, spare parts requisitions, engine parameter trends, fuel consumption analysis.
Primary screen: Vessel-specific maintenance & engineering
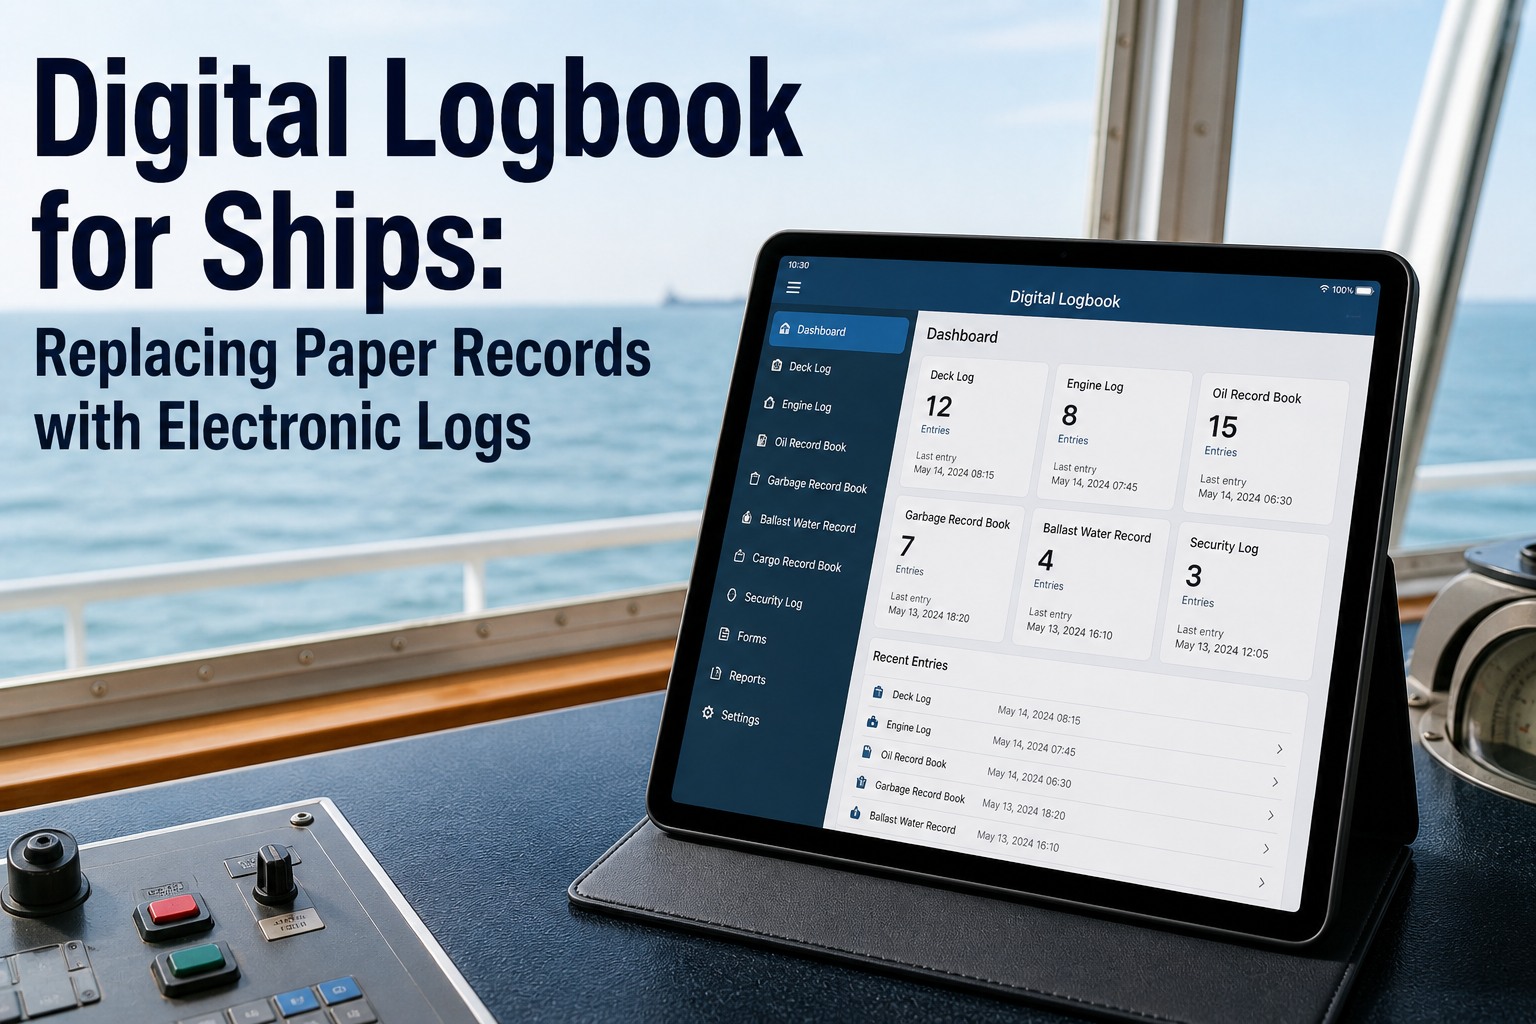
Operational status focus. Certificate validity, current voyage status, weather/route, port arrival/departure, drill schedule, crew documentation.
Primary screen: Voyage & certification at-a-glance
Strategic / financial summary view. Cost per mile trend, fleet TCO, fuel benchmark vs market, off-hire impact, ROI of key initiatives.
Primary screen: Boardroom-ready KPIs & trends
The Real-Time Data Sources Powering Modern Marine Dashboards
A dashboard is only as good as its data feed. Marine fleet management dashboards in 2026 ingest data from at least six distinct source types — and the quality of integration with each determines how real-time and complete the dashboard view actually is. Static daily-report-driven dashboards offer Monday-morning visibility; sensor-driven dashboards offer minute-by-minute decisions.
A
AIS & GPS Position Feeds
Satellite + terrestrial AIS networks track 661,000+ vessels globally with billions of signals processed daily. Real-time position, speed, heading, ETA, port events, geofencing alerts.
B
Engine & Machinery Telemetry
Engine RPM, fuel flow, exhaust temperature, oil pressure, vibration, generator load — sensor data fed via vessel data acquisition systems to shore in near real-time.
C
Maintenance & CMMS Records
Planned and unplanned work orders, completed jobs, overdue items, spare parts consumption, downtime events. Source of truth for maintenance KPIs.
D
Certificate & Compliance Database
Statutory and class certificates, ISM/ISPS records, ISO certifications, drill logs, training records, PSC inspection history. Drives compliance pillar.
E
Voyage / Daily Report Data
Master's noon reports, fuel consumption logs, weather observations, voyage events. Manual but critical — the connective tissue between sensor data and operational context.
F
Commercial & Charter Data
Charter party terms, off-hire events, performance claims, demurrage tracking. Drives commercial KPIs and dispute resolution.
What Separates a Marine Dashboard From a Generic Fleet Dashboard
Land fleet management dashboards (trucks, vans, construction equipment) evolved from telematics platforms with relatively simple data sources: GPS position, engine hours, driver behavior. Marine fleet dashboards face fundamentally different operational realities that demand purpose-built capabilities — and most generic fleet platforms cannot accommodate them.
Sea-State & Weather Integration
Marine dashboards must factor weather, sea state, current and wind into utilization metrics. Vessel on weather hold is not the same as vessel down. Generic fleet software treats both as "not operating."
Satcom Bandwidth Optimization
Vessels at sea operate with metered satcom bandwidth. Marine dashboards optimize what data is sent shore-side and when, balancing real-time visibility against bandwidth cost.
Port Event & Berth Tracking
Arrival, pilot embarkation, berthing, cargo operations, departure — each is a discrete event with timing implications. Generic fleet software has no equivalent of port-event taxonomy.
Maritime Compliance Frameworks
SOLAS, MARPOL, ISM, ISPS, MLC, EU MRV, IMO DCS — none of these has any analogue in road transport. Compliance dashboards must be built around them, not adapted.
Class Society Integration
Surveys, notations, PMS approvals, condition-based maintenance regimes — class society relationship is foundational to vessel inspection cycles. Marine dashboards integrate with DNV, LR, ABS, BV systems.
Carbon & Emissions Reporting
CII rating, EU ETS scope, MRV reporting, IMO DCS submission — emissions reporting is a fleet-level dashboard pillar. Maritime is approximately 3% of global CO2; regulator scrutiny is intense.
The ROI Math — Why Visibility Pays For Itself
The investment case for a modern marine fleet dashboard is not abstract. Industry analysis identifies measurable returns across five dimensions, with payback typically within 12-18 months for mid-size fleets.
30%
Maintenance Cost Reduction
Predictive analytics revolutionize fleet management by reducing maintenance costs by up to 30% through pattern recognition surfacing issues before failures.
30 hrs
/Vessel/Year on Reporting
Industry estimates indicate digital emissions reporting alone saves up to 30 hours per vessel per year through automated data collection.
20-30 hr
/Month on Stakeholder Reports
Manual report generation consumes 20-30 hours monthly compiling data from multiple sources. Automated dashboards generate the same outputs in seconds.
10s
From Login to Decision
Best-practice modern fleet dashboards take a manager from login to "I know which three vessels need my attention" in under 10 seconds.
PSC
Detention Avoidance
Real-time certificate expiry alerts and SMS health monitoring prevent the detention scenarios that cost orders of magnitude more than dashboard subscription cost.
Run the Numbers Against Your Fleet — Then Decide
Marine Inspection's dashboard delivers the four-pillar architecture, role-based views, AIS + telemetry integration, real-time compliance alerts, and audit-ready evidence packs in one platform. Book a demo with your fleet data preloaded.
Implementation Roadmap — From RFP to Live Dashboard in 10 Weeks
Modern marine fleet dashboards reach productive use in 10 weeks for mid-size fleets. The roadmap below assumes existing maintenance and certificate data exists in some form (paper, spreadsheets, legacy CMMS) and integrates with the dashboard during configuration. Greenfield implementations may run longer; full enterprise integrations of multi-fleet operators run 6-12 months.
PHASE 1
Wk 1-2
Pillar & Metric Selection
Fleet manager + DPA + superintendent + finance lead align on the 4 north-star KPIs and 20-25 supporting metrics that map to operational priorities.
PHASE 2
Wk 3-4
Data Source Integration
Maintenance data import, certificate database setup, voyage report templates configured, AIS feed integration, telemetry connectors enabled where available.
PHASE 3
Wk 5-6
Role-Based Views
Fleet manager, superintendent, DPA, chief engineer, master dashboard variants configured. Mobile responsive layouts validated on actual field-use devices.
PHASE 4
Wk 7-8
Pilot Deployment
Initial vessel cohort onboarded; data flowing; alerts active. Real-world feedback gathered from each role; thresholds tuned to match operational reality.
PHASE 5
Wk 9-10
Fleet Rollout & Training
Phased rollout to remaining fleet. Master / chief / DPA training sessions. Established review cadence (daily for fleet manager; weekly for board summary).
Why Marine Inspection — and How to Get Started in 60 Seconds
Marine Inspection's fleet dashboard is built around the four-pillar architecture from day one — not as a bolt-on visualization on top of a legacy database. Real-time AIS integration, role-based views, mobile-first responsive design, certificate expiry alerts wired to maintenance completion, automated EU MRV / IMO DCS reporting. Book a live demo with sample fleet data, or sign up for a free trial to explore on your own.
01
Four-Pillar Architecture, Out of the Box
Cost / Utilization / Safety / Compliance pillars pre-configured with industry-standard metrics. Fleet-specific tuning at deployment, not custom development.
02
Role-Based Views Across Fleet Manager / Superintendent / DPA / Master
Each role gets their primary screen tuned for their daily decisions. One platform, six perspective layers, zero force-fitting onto a generic view.
03
Mobile-First — Decisions On the Move
Fleet managers monitor from phones during yard walks, port visits and after-hours incidents. No desktop dependency means real-time visibility wherever the manager is.
04
Certificate Expiry Alerts Wired To Maintenance Completion
SOLAS radio survey closed = radio certificate database updated. Class survey completed = renewal certificate logged. The integration gaps that detain vessels are closed by architecture.
05
EU MRV / IMO DCS / CII Reporting Integrated
Sustainability and emissions reporting auto-generated from same maintenance and voyage data. 30 hours per vessel per year saved on emissions reporting alone.
06
10-Week Implementation, Not 12-Month Enterprise Project
Phased deployment from RFP through pilot to fleet rollout in 10 weeks for mid-size operators. No 6-month enterprise consulting engagement required.
Book a Demo This Week. See Your Fleet on the Dashboard Next Week.
Four-pillar architecture, role-based views, real-time AIS + telemetry, certificate expiry alerts, EU MRV / IMO DCS reporting, mobile-first responsive — all in one platform built for marine fleet operators in 2026.
Frequently Asked Questions
How many KPIs should a marine fleet dashboard show on the main screen?
Between 4 and 8 metrics on the glance layer — no more. Showing 30+ KPIs with equal visual weight creates dashboard fatigue and forces the manager to do the cognitive work of prioritizing. The industry best practice in 2026 is 4 north-star KPIs (one per strategic pillar — Cost, Utilization, Safety, Compliance) shown large at the top, with 4-6 supporting metrics in a secondary band. All remaining metrics should be accessible through one-click drill-down, not dumped onto the main view.
What's the difference between fleet tracking and a fleet management dashboard?
Fleet tracking shows where vessels are in real time — a live map with vessel positions from AIS feeds. A fleet management dashboard goes further: it integrates AIS position with maintenance data, certificate status, fuel consumption, port events, charter performance, compliance metrics, and predictive analytics. Fleet tracking answers "where are my vessels?" Fleet management answers "which three vessels need my attention now, and why?"
How important is mobile-first design for marine fleet dashboards?
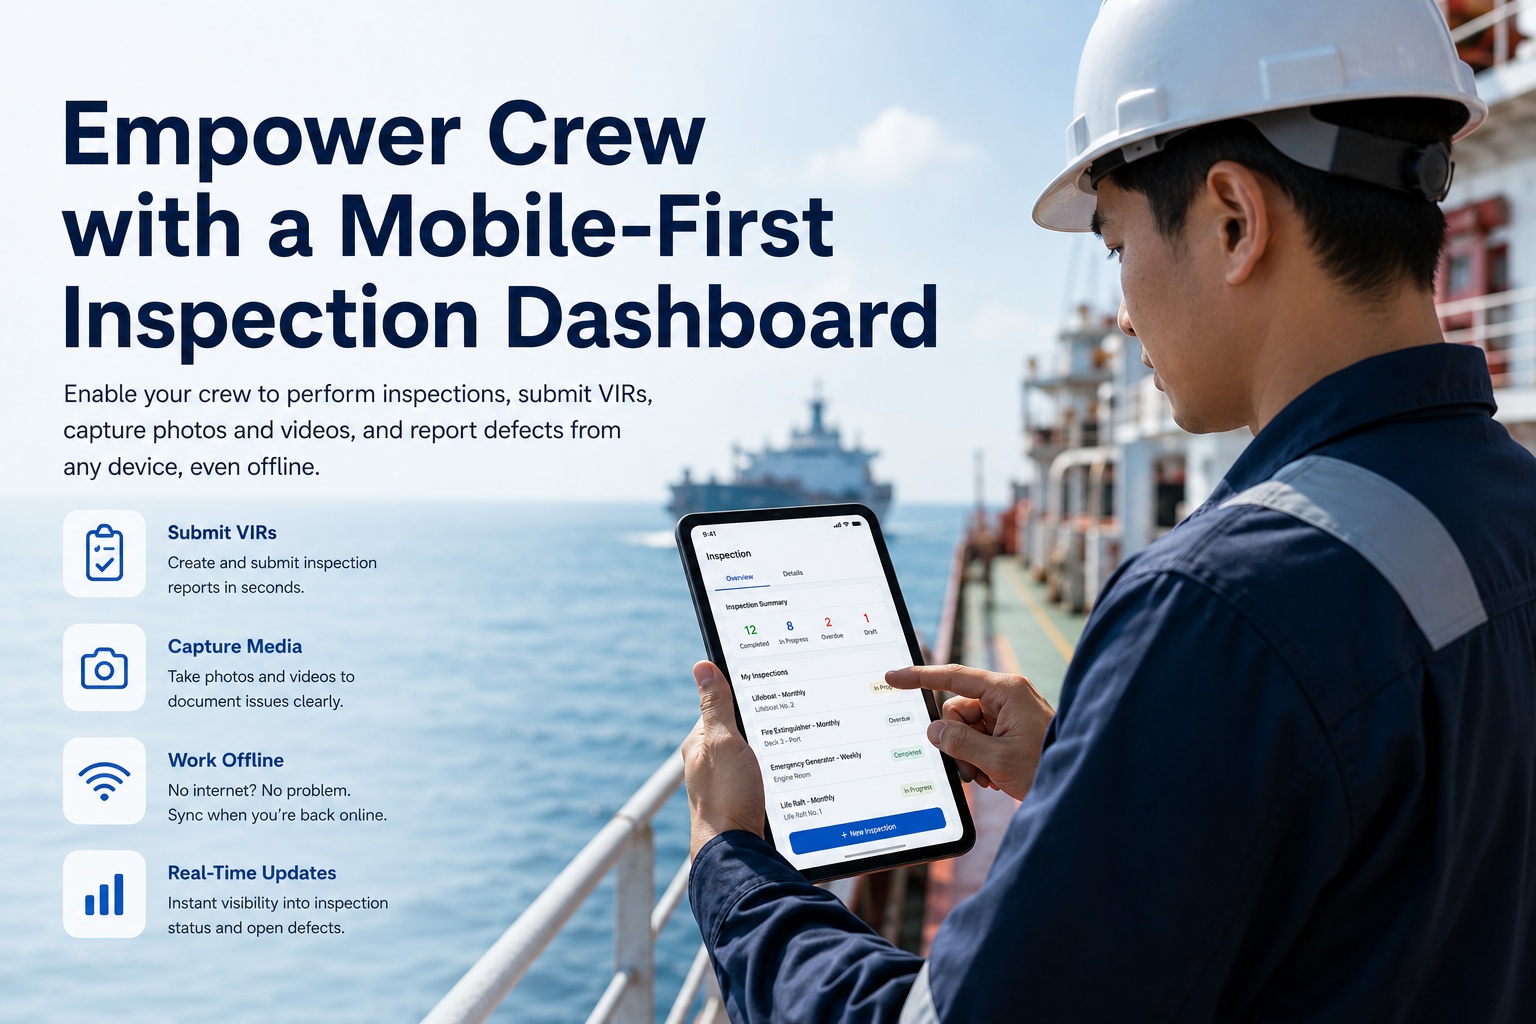
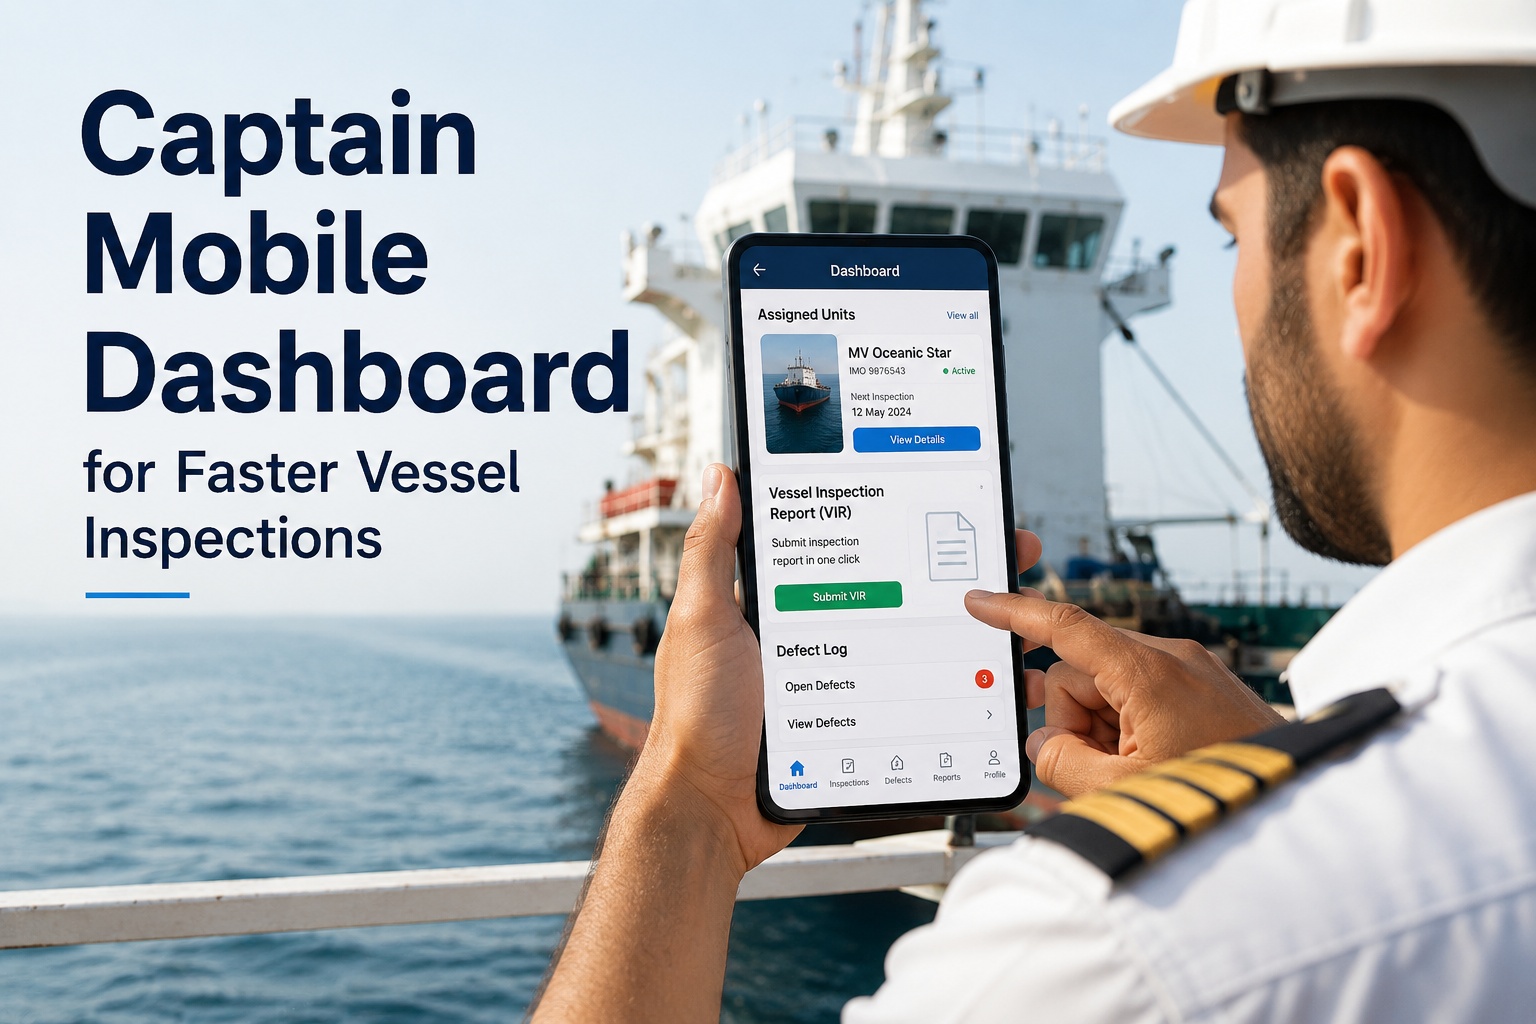
Essential. Fleet managers, superintendents and DPAs make decisions on phones during port visits, dry-dock walks, after-hours incidents, and travelling between offices. A dashboard that only works on desktop forces them back to the office — defeating the purpose of real-time visibility. Proper mobile-first design does not just shrink the desktop layout; it reorders widgets into a single column with the most critical information at the top, uses larger tap targets, and prioritizes vertical scrolling.
Should every role share the same dashboard view?
No — different views for different roles. A fleet manager needs high-level financial and compliance KPIs. A superintendent needs vessel-level technical condition. A DPA needs SMS audit and regulatory exposure. A chief engineer needs maintenance backlog and engine performance. A master needs operational status and certificate validity. Forcing all roles onto the same cluttered view is one of the biggest UI failures in legacy fleet software. Modern platforms apply role-based personalization so each user sees their relevant metrics first.
What ROI can be expected from implementing a marine fleet dashboard?
Five compounding value streams: 30% maintenance cost reduction through predictive analytics; 30 hours per vessel per year saved on emissions reporting through automation; 20-30 hours per month saved on stakeholder report compilation; faster decision speed (login-to-action under 10 seconds vs hours of spreadsheet navigation); and detention avoidance through real-time certificate expiry alerts. Payback typically within 12-18 months for mid-size fleets.
What data sources does a modern marine fleet dashboard ingest?
Six primary source types: AIS and GPS position feeds for real-time location and port events; engine and machinery telemetry for performance metrics; maintenance and CMMS records for work order and downtime data; certificate and compliance database for regulatory tracking; voyage and daily report data for operational context; and commercial and charter data for performance and demurrage. The quality of integration with each source determines how real-time and complete the dashboard view actually is.
How long does implementation take?
Modern marine fleet dashboards reach productive use in 10 weeks for mid-size fleets across five phases: pillar and metric selection (Wk 1-2); data source integration (Wk 3-4); role-based view configuration (Wk 5-6); pilot deployment (Wk 7-8); fleet rollout and training (Wk 9-10). Greenfield implementations or operators with no existing maintenance data may run longer; full enterprise integrations across multiple fleets run 6-12 months.
How does Marine Inspection support marine fleet dashboards?
Pre-configured four-pillar architecture (Cost, Utilization, Safety, Compliance) with industry-standard KPIs out of the box. Six role-based views (fleet manager, superintendent, DPA, chief engineer, master, executive). Real-time AIS integration plus telemetry, maintenance, certificate, voyage and commercial data sources. Mobile-first responsive design tested on phones in field conditions. Certificate expiry alerts wired to maintenance completion. EU MRV / IMO DCS / CII reporting integrated. 10-week implementation timeline for mid-size fleets. Book a live demo or start a free trial to evaluate against your fleet.