Fuel efficiency at sea is no longer just a cost metric — since 2023 it is a regulated rating that determines whether a vessel can keep trading. The IMO now requires every cargo and passenger ship to measure its efficiency against hard targets: a one-time technical index for the ship as built, and an annual operational rating on an A-to-E scale that tightens every year toward a forty-percent carbon-intensity cut by 2030. A vessel rated D for three years, or E for one, is non-compliant and must produce a corrective plan. That makes efficiency tracking two things at once — the lever on a fleet's largest cost and the gauge of its regulatory standing. The metrics that matter are specific and measurable: specific fuel oil consumption at the engine, kilograms of fuel per nautical mile at the vessel, and grams of CO2 per ton-mile of transport work for the regulator. Track them per vessel and benchmark them against IMO and industry references, and a fleet can see exactly which ships are efficient, which are drifting toward a poor rating, and where a cheaper, cleaner voyage is hiding. This guide explains the core efficiency metrics, the IMO benchmark framework, how the A-to-E rating works, and why continuous tracking is now essential rather than optional. To see vessel efficiency benchmarked against IMO targets live, book a Marine Inspection demo.
Measured, rated, benchmarked
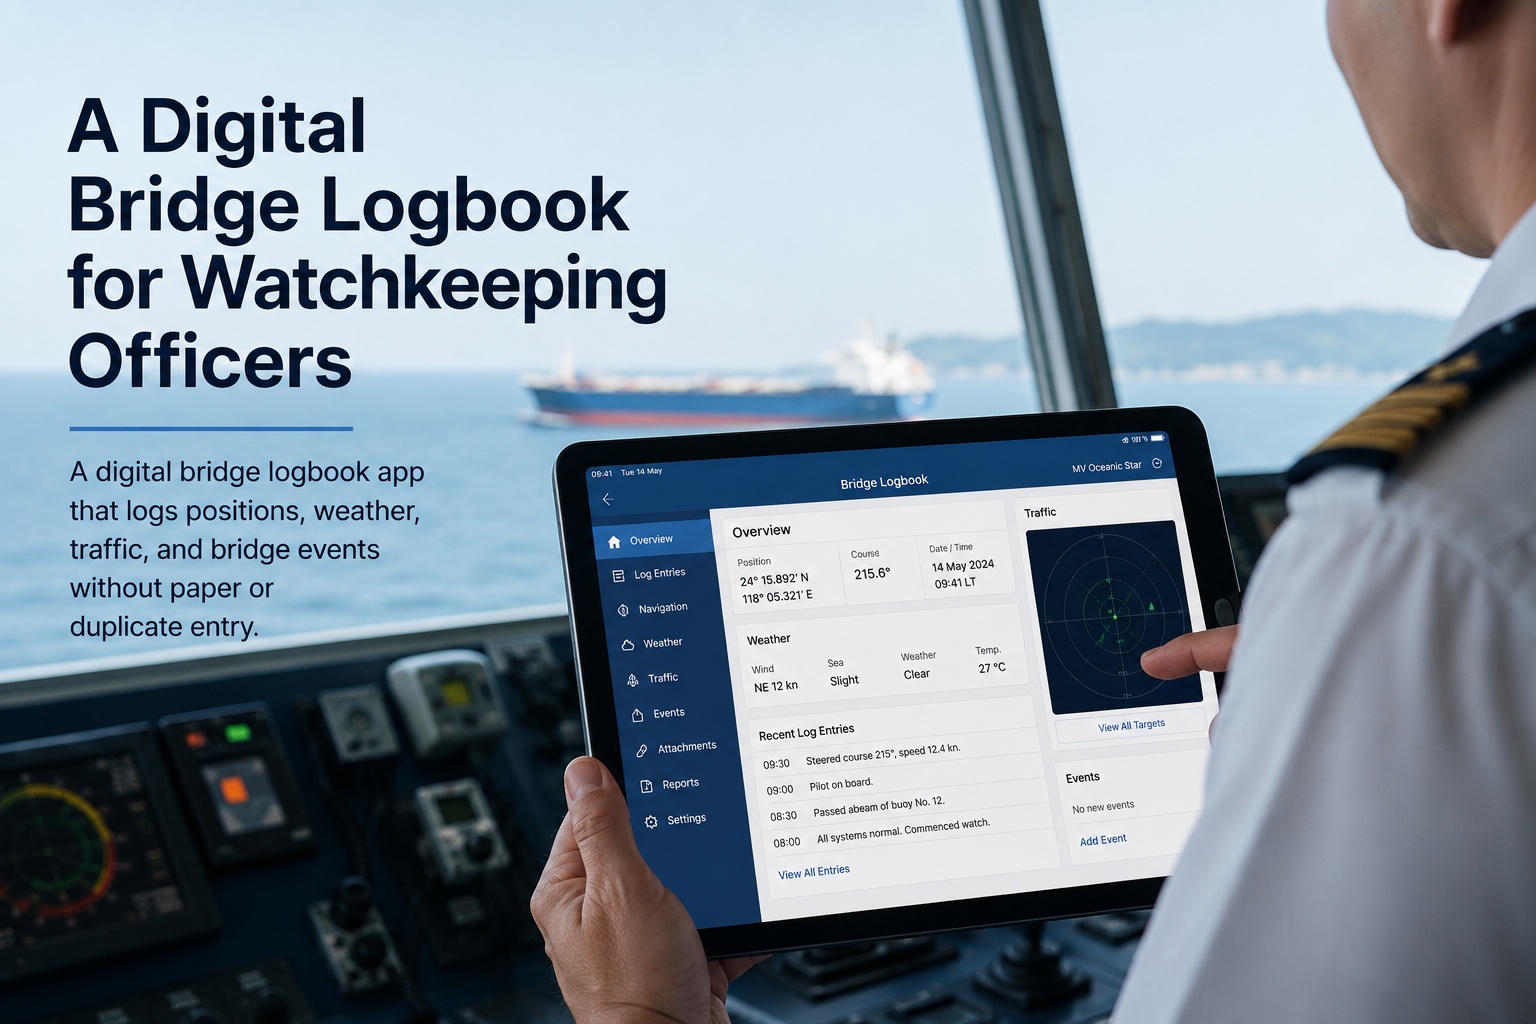
Benchmark Vessel Fuel Efficiency Against IMO Targets
Measure SFOC, kg per nautical mile, and ton-mile efficiency per vessel, and benchmark every ship against IMO and industry references — for cleaner, cheaper voyages and a compliant CII rating.
A–Eannual CII rating, C or better to comply
40%carbon-intensity cut required by 2030
g/t·nmthe unit the regulator measures you in
Book a Demo
The Three Levels of Fuel Efficiency Measurement
Vessel efficiency is measured at three levels, each answering a different question — how efficiently the engine burns fuel, how much fuel the vessel uses to cover distance, and how cleanly it moves cargo. A complete tracking system captures all three, because each drives a different decision. See the metrics in a demo.
Engine
SFOC — Specific Fuel Oil Consumption
Grams of fuel per kilowatt-hour of engine output. It measures how efficiently the engine itself converts fuel to power, and a rising SFOC signals engine wear or a tuning problem before it shows anywhere else.
Vessel
kg/NM — Fuel per Nautical Mile
Kilograms of fuel burned per nautical mile sailed. It normalizes consumption to distance so legs and vessels can be compared on a like basis, independent of voyage length.
Transport
Ton-mile efficiency — CO2 per transport work
Grams of CO2 per ton of cargo per nautical mile — the regulator's view, linking emissions to useful transport work. This is the basis of the IMO carbon-intensity framework.
The IMO Benchmark Framework
The targets a fleet benchmarks against are not arbitrary industry figures — they are the IMO's regulated indices, introduced under MARPOL Annex VI to cut shipping's carbon intensity by forty percent by 2030. Understanding the three is the foundation of efficiency tracking.
The IMO Efficiency Indices
The key distinction is technical versus operational. EEXI and EEDI assess the ship as built — installed engine power, SFOC, and a fuel-to-CO2 conversion factor against capacity and speed — and are certified once. CII assesses how the ship is actually operated, year after year, and is where day-to-day efficiency tracking pays off or costs you.
How the CII A-to-E Rating Works
The CII is the rating that bites operationally. Each year a vessel's actual carbon intensity is calculated and compared against a required value specific to its type and size, then placed in one of five bands. The thresholds tighten every year, so a rating that passes today may not next year without improvement.
A
Major superior — well below the required intensity
B
Minor superior — better than required
C
Moderate — meets the requirement, compliant
D
Minor inferior — non-compliant if sustained
E
Inferior — non-compliant, plan required
A vessel needs a C rating or better to be compliant. A ship rated D for three consecutive years, or E for a single year, must develop a corrective action plan and incorporate it into its SEEMP. Because the required value reduces by roughly two percent a year through 2026 and tightens further to 2030, standing still means sliding down the bands — which is precisely why continuous tracking, not annual reporting, is what keeps a vessel ahead of its rating.
See it on your fleet
Know Your CII Rating Before the Regulator Does
Marine Inspection tracks SFOC, kg per nautical mile, and ton-mile efficiency per vessel, projects your CII rating against the tightening IMO thresholds, and benchmarks every ship against its sisters and the fleet. Book a 30-minute demo to see efficiency benchmarking on a fleet like yours, or start a free trial and connect your data today.
Benchmarking: Against the Baseline and the Fleet
A single efficiency number means little in isolation. Its value comes from comparison — against the vessel's own clean-condition baseline, against its sister ships, and against the IMO required value. Each comparison answers a different question. See benchmarking in a demo.
Against its own baseline
Current efficiency versus the vessel's sea-trial or clean-condition envelope, quantifying degradation from fouling or wear over time.
Against sister vessels
Normalized KPIs compared across similar ships, exposing which vessels run lean and which carry a hidden efficiency problem.
Against the IMO required value
Actual carbon intensity against the type-and-size-specific required CII, showing the margin to the next rating band.
Against industry references
Performance set against sector benchmarks, useful for chartering decisions and demonstrating efficiency to customers.
What Drives the Numbers — and How to Improve Them
Once efficiency is measured and benchmarked, the levers that move it become clear. Tracking is what tells you which lever matters for which vessel, so effort goes where it pays.
Speed management
Consumption rises sharply with speed, so optimizing speed against schedule is often the single largest operational lever on kg/NM and CII.
Hull & propeller condition
Fouling raises resistance and SFOC over time; tracking efficiency loss triggers cleaning when it will pay for itself.
Trim optimization
The right trim for the load and speed cuts resistance, a measurable gain validated through consumption data.
Engine performance
A rising SFOC flags engine wear or tuning issues, linking efficiency tracking directly to condition-based maintenance.
Technical measures
Power limitation, waste-heat recovery, and wind assistance improve the technical index for vessels needing EEXI compliance.
Voyage & weather routing
Routing to avoid adverse weather lowers consumption per ton-mile, improving both cost and the operational rating.
How Marine Software Tracks Efficiency — and Why It's Needed
Efficiency tracking only works if the metrics are captured consistently, calculated correctly against IMO formulas, and projected forward against tightening thresholds. Purpose-built marine software does all three, where manual reporting cannot.
Captures the source data
Consumption, power, speed, distance, and cargo are captured consistently per voyage, the inputs every efficiency metric depends on.
Calculates SFOC, kg/NM, ton-mile
The three efficiency levels are computed automatically and normalized, so vessels and voyages compare on a true like-for-like basis.
Projects the CII rating
Real operational data is tracked against the type-specific required value and the tightening thresholds, so a slide toward D or E is seen early.
Benchmarks fleet-wide
Every vessel is compared against its baseline, its sisters, and the IMO reference, surfacing outliers and improvement targets at a glance.
Feeds compliance reporting
The same data populates IMO DCS, the SEEMP, and FuelEU reporting, so efficiency tracking and compliance come from one source.
Links to maintenance
A rising SFOC or efficiency loss triggers condition-based maintenance, connecting the rating directly to the actions that improve it.
The deeper reason it is needed is that the CII is a moving target. The required value tightens every year, so a vessel that does nothing slides down the rating bands automatically — and by the time an annual report reveals a D rating, a year of inefficient operation is already locked in. Continuous tracking projects the rating forward, so a fleet acts on a speed policy or a hull cleaning while it still changes the outcome, rather than discovering the problem after it is unfixable for that year. Book a demo to see it on your fleet.
Frequently Asked Questions
What is vessel fuel efficiency tracking?
It is measuring a vessel's fuel efficiency at the engine, vessel, and transport levels — SFOC, kilograms per nautical mile, and CO2 per ton-mile — and benchmarking those metrics against the vessel's baseline, its sister ships, and the IMO required values. It serves both cost control and regulatory compliance with the CII rating framework.
What is SFOC?
Specific Fuel Oil Consumption is the grams of fuel an engine burns per kilowatt-hour of output. It measures how efficiently the engine converts fuel into power, independent of how the vessel is operated. A rising SFOC signals engine wear or a tuning problem, making it a valuable early indicator for condition-based maintenance.
What is the difference between EEXI and CII?
EEXI is a technical, one-time index assessing a ship's energy efficiency as built — installed power, SFOC, and a CO2 conversion factor against capacity and speed — and applies to ships of 400 GT and above. CII is an operational measure rating a vessel's actual annual carbon intensity on an A-to-E scale, applies to ships of 5,000 GT and above, and is recalculated every year.
What CII rating does a vessel need?
A vessel needs a C rating or better to be compliant. A ship rated D for three consecutive years, or E for a single year, is deemed non-compliant and must develop a corrective action plan within its SEEMP. Because the required thresholds tighten each year toward a forty-percent carbon-intensity cut by 2030, maintaining a rating requires ongoing improvement.
How is ton-mile efficiency measured?
Ton-mile efficiency expresses emissions as grams of CO2 per ton of cargo carried per nautical mile — linking fuel use to useful transport work. The IMO currently favours the Annual Efficiency Ratio, which uses deadweight rather than actual cargo, for the CII. It is the metric that connects a vessel's operational fuel efficiency to its regulatory carbon intensity.
Why track efficiency continuously instead of annually?
Because the CII is calculated on a full year of operation and its thresholds tighten annually, an annual report reveals a poor rating only after the year is over and the inefficiency is locked in. Continuous tracking projects the rating forward, so a fleet can adjust speed, trim, routing, or maintenance while it still changes the outcome for that rating year.
Built for marine efficiency & compliance
Cleaner, Cheaper Voyages — and a Rating You Control
SFOC, kg per nautical mile, and ton-mile efficiency per vessel; baseline, sister-ship, and IMO benchmarking; CII rating projection against tightening thresholds; and DCS and SEEMP reporting — all in one platform linked to your maintenance. Marine Inspection turns efficiency into a number you manage, not one you discover. Book a tailored walkthrough or start a free trial today.